Financial clarity for founder-led companies
From daily operational KPIs to sell-side reporting. One tool that turns your trial balances into financial intelligence you can actually act on.
Two reasons to know your numbers
Whether you're optimising operations or preparing for a transaction, CFO Foundry delivers both from the same data.
Operational Excellence
Know your numbers daily. Not quarterly when the accountant delivers. Real-time financial intelligence that makes you a better operator.
- Monthly P&L with margins and YoY trends
- Cash cycle: DSO, DPO, FCF, Current Ratio
- Workforce billability and utilisation
- Cost structure visibility per department
- NWC monitoring and efficiency tracking
- Rule of 40 for growth vs. profitability balance
Sell-Side Readiness
When the call comes, whether from a PE, a strategic buyer, or your own decision to explore, be ready in days, not months.
- 3 years of clean monthly management accounts
- Adjusted EBITDA with configurable add-backs
- IC elimination across all entities
- Data room checklist with 30+ DD items
- Excel and PowerPoint exports for distribution
- Consolidated multi-entity reporting
You built the company.
But do you really know your numbers?
Most founder-led service companies run on intuition and quarterly reports. Until reality demands precision.
Flying Blind on Cash
Revenue grows but cash doesn't follow. NWC, DSO, DPO: concepts you've heard but never tracked monthly.
No Monthly Reporting
Your accountant delivers trial balances. Nobody turns them into a P&L with year-over-year trends and margin tracking.
Multi-Entity Chaos
Entities on different charts of accounts and in different currencies. Consolidation happens in someone's head.
Utilisation Guesswork
You think billability is 75% but can't prove it. Revenue per FTE? Cost centre profitability? No idea.
Excel Dependency
50 tabs, broken formulas, version conflicts. One wrong link and EBITDA is off by 200k.
The DD Scramble
A buyer asks for adjusted EBITDA, NWC bridge, IC elimination. You have two weeks. Every time, it's a fire drill.
Everything a CFO needs.
Nothing they don't.
Operational intelligence and sell-side readiness from the same data source.
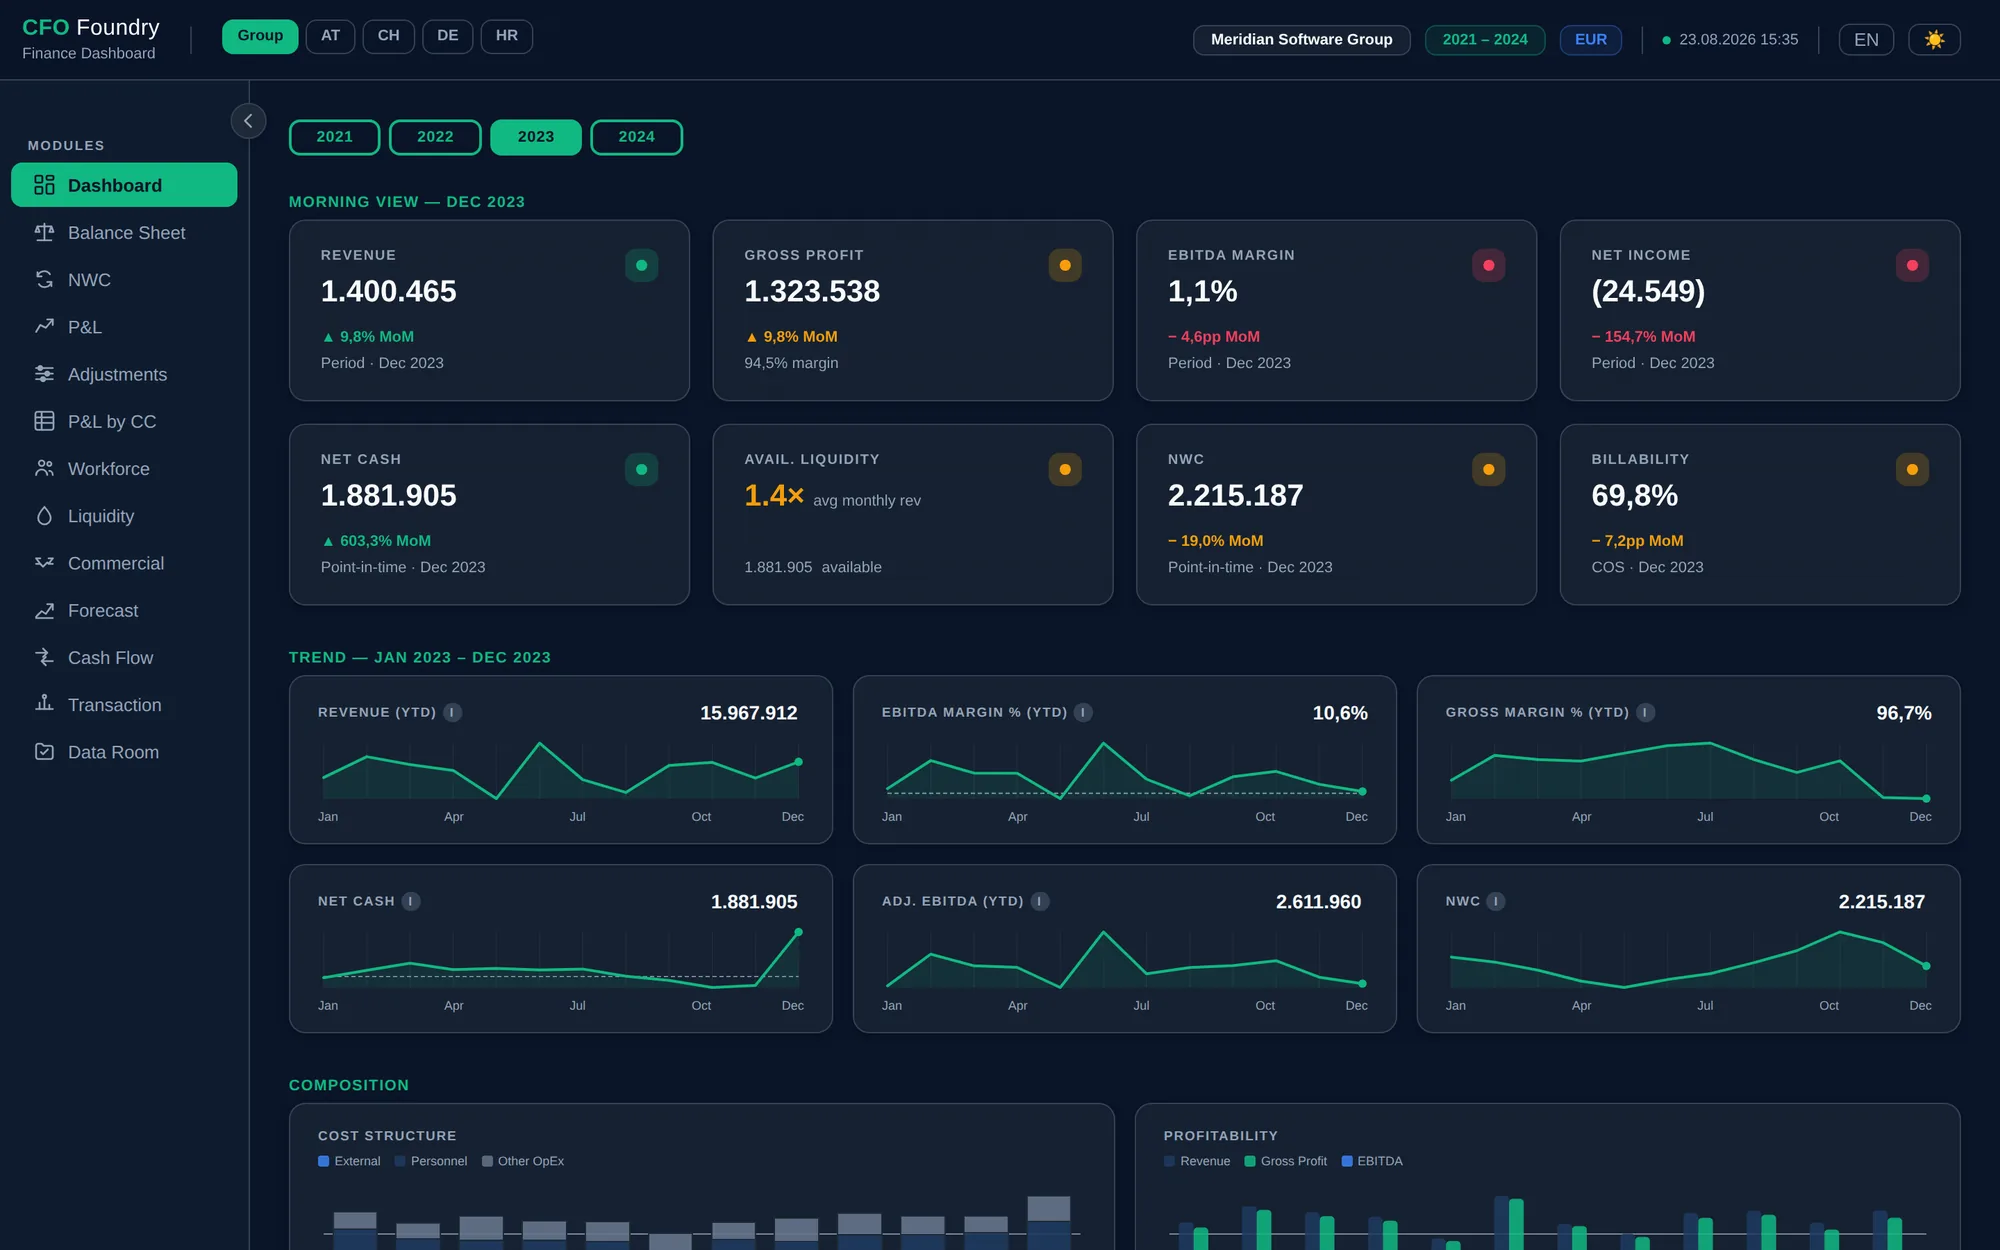
Monthly Dashboard
Eight KPI cards with MoM deltas. Sparkline trends. Cost structure bars. Cash cycle metrics. Year-over-year comparison.
- Revenue, EBITDA, margins, billability
- DSO, DPO, CCC, Current Ratio
- Free Cash Flow & FCF Yield
- Rule of 40 with colour coding
Meridian is a fictional demo company. All figures are sample data.
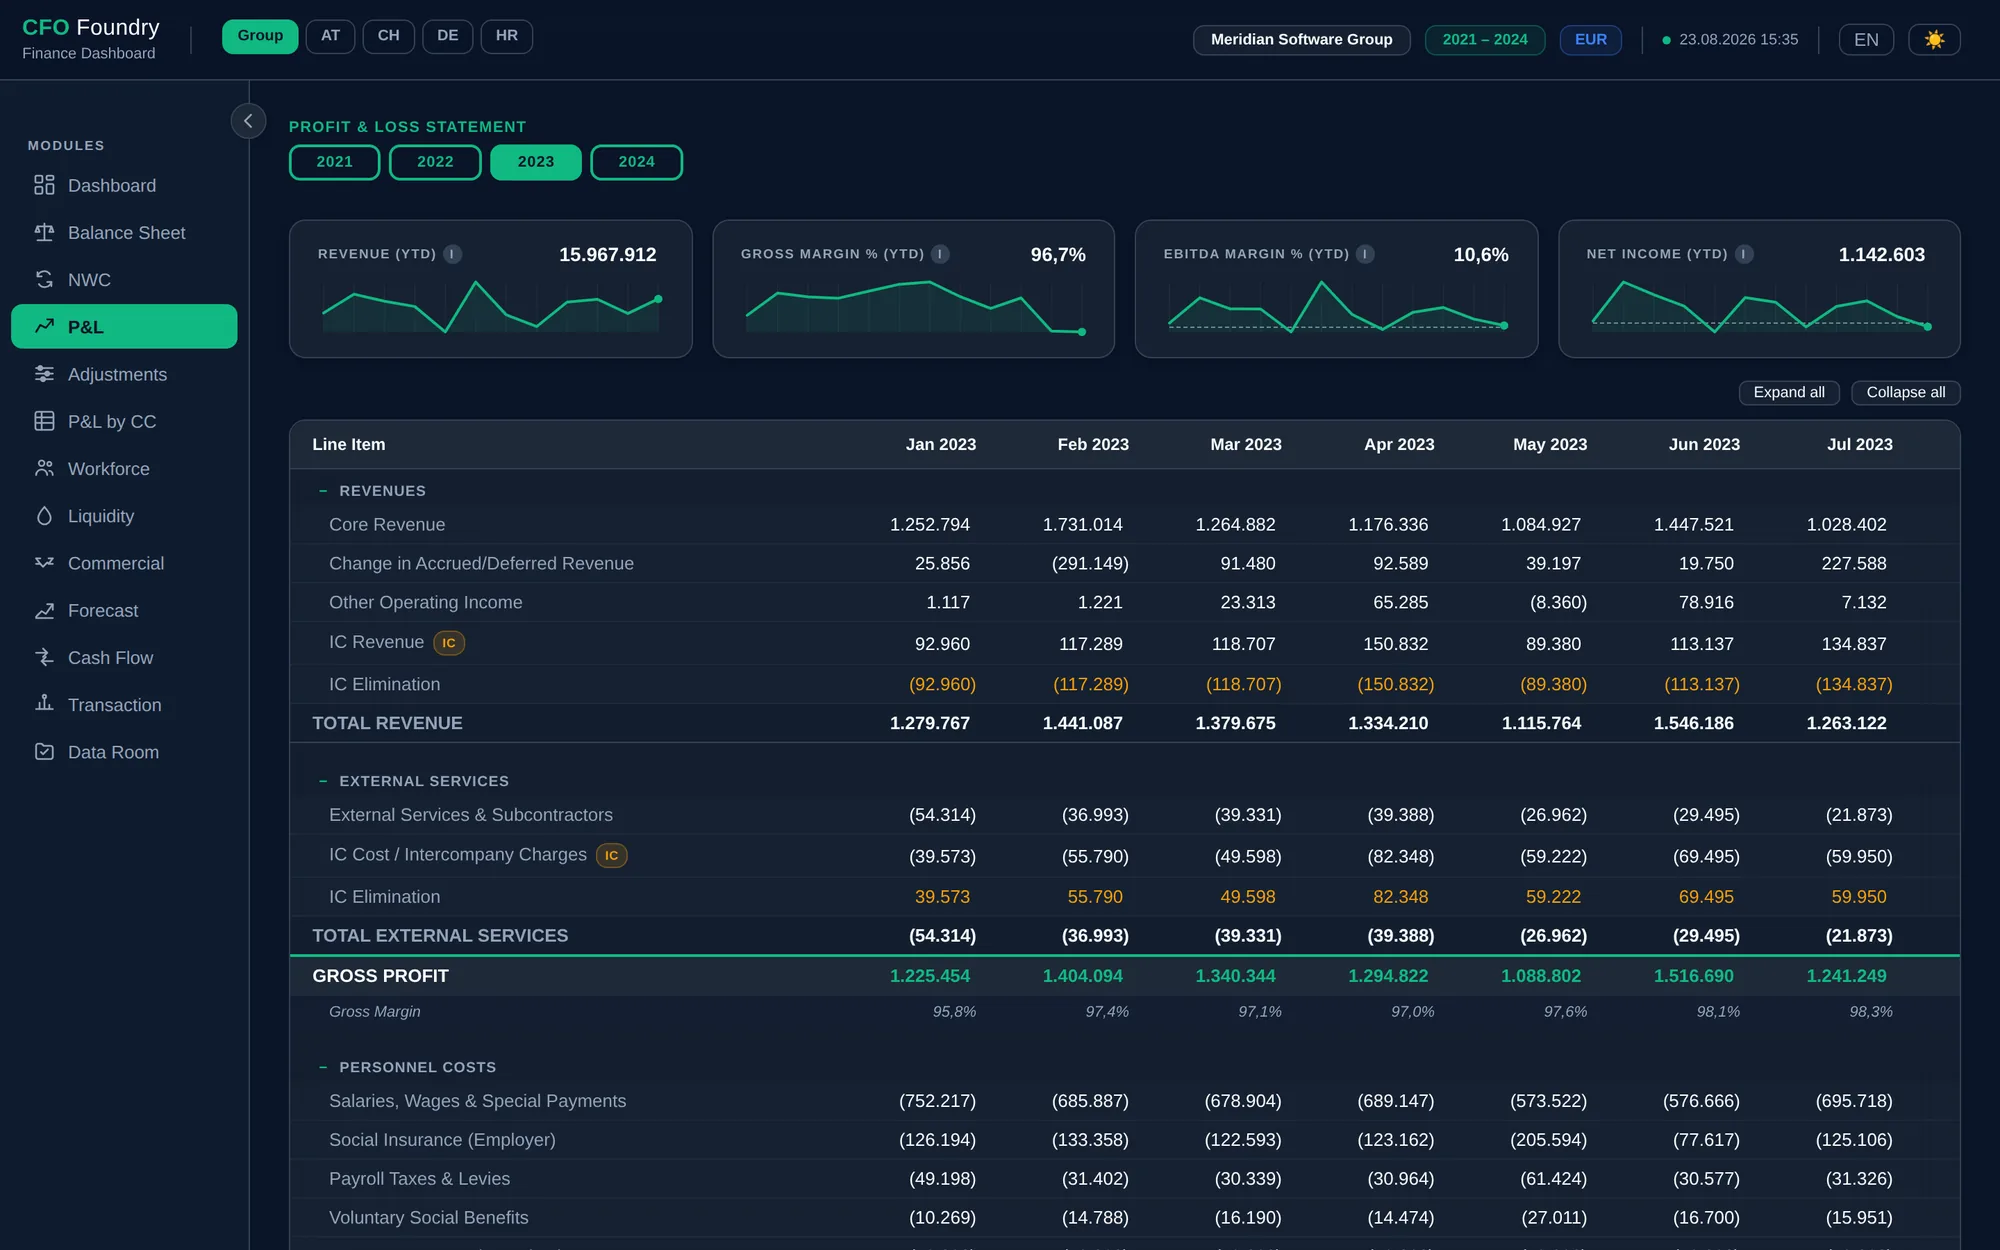
P&L Intelligence
Monthly P&L with collapsible sections, prior year comparison (PY / Δ / Δ%), and inline margin KPIs. Info tooltips on every metric.
- Personnel/Revenue % and OpEx/Revenue %
- Adjusted EBITDA with add-back editor
- IC elimination detail (consolidated)
- Sparkline trend cards per year
Meridian is a fictional demo company. All figures are sample data.
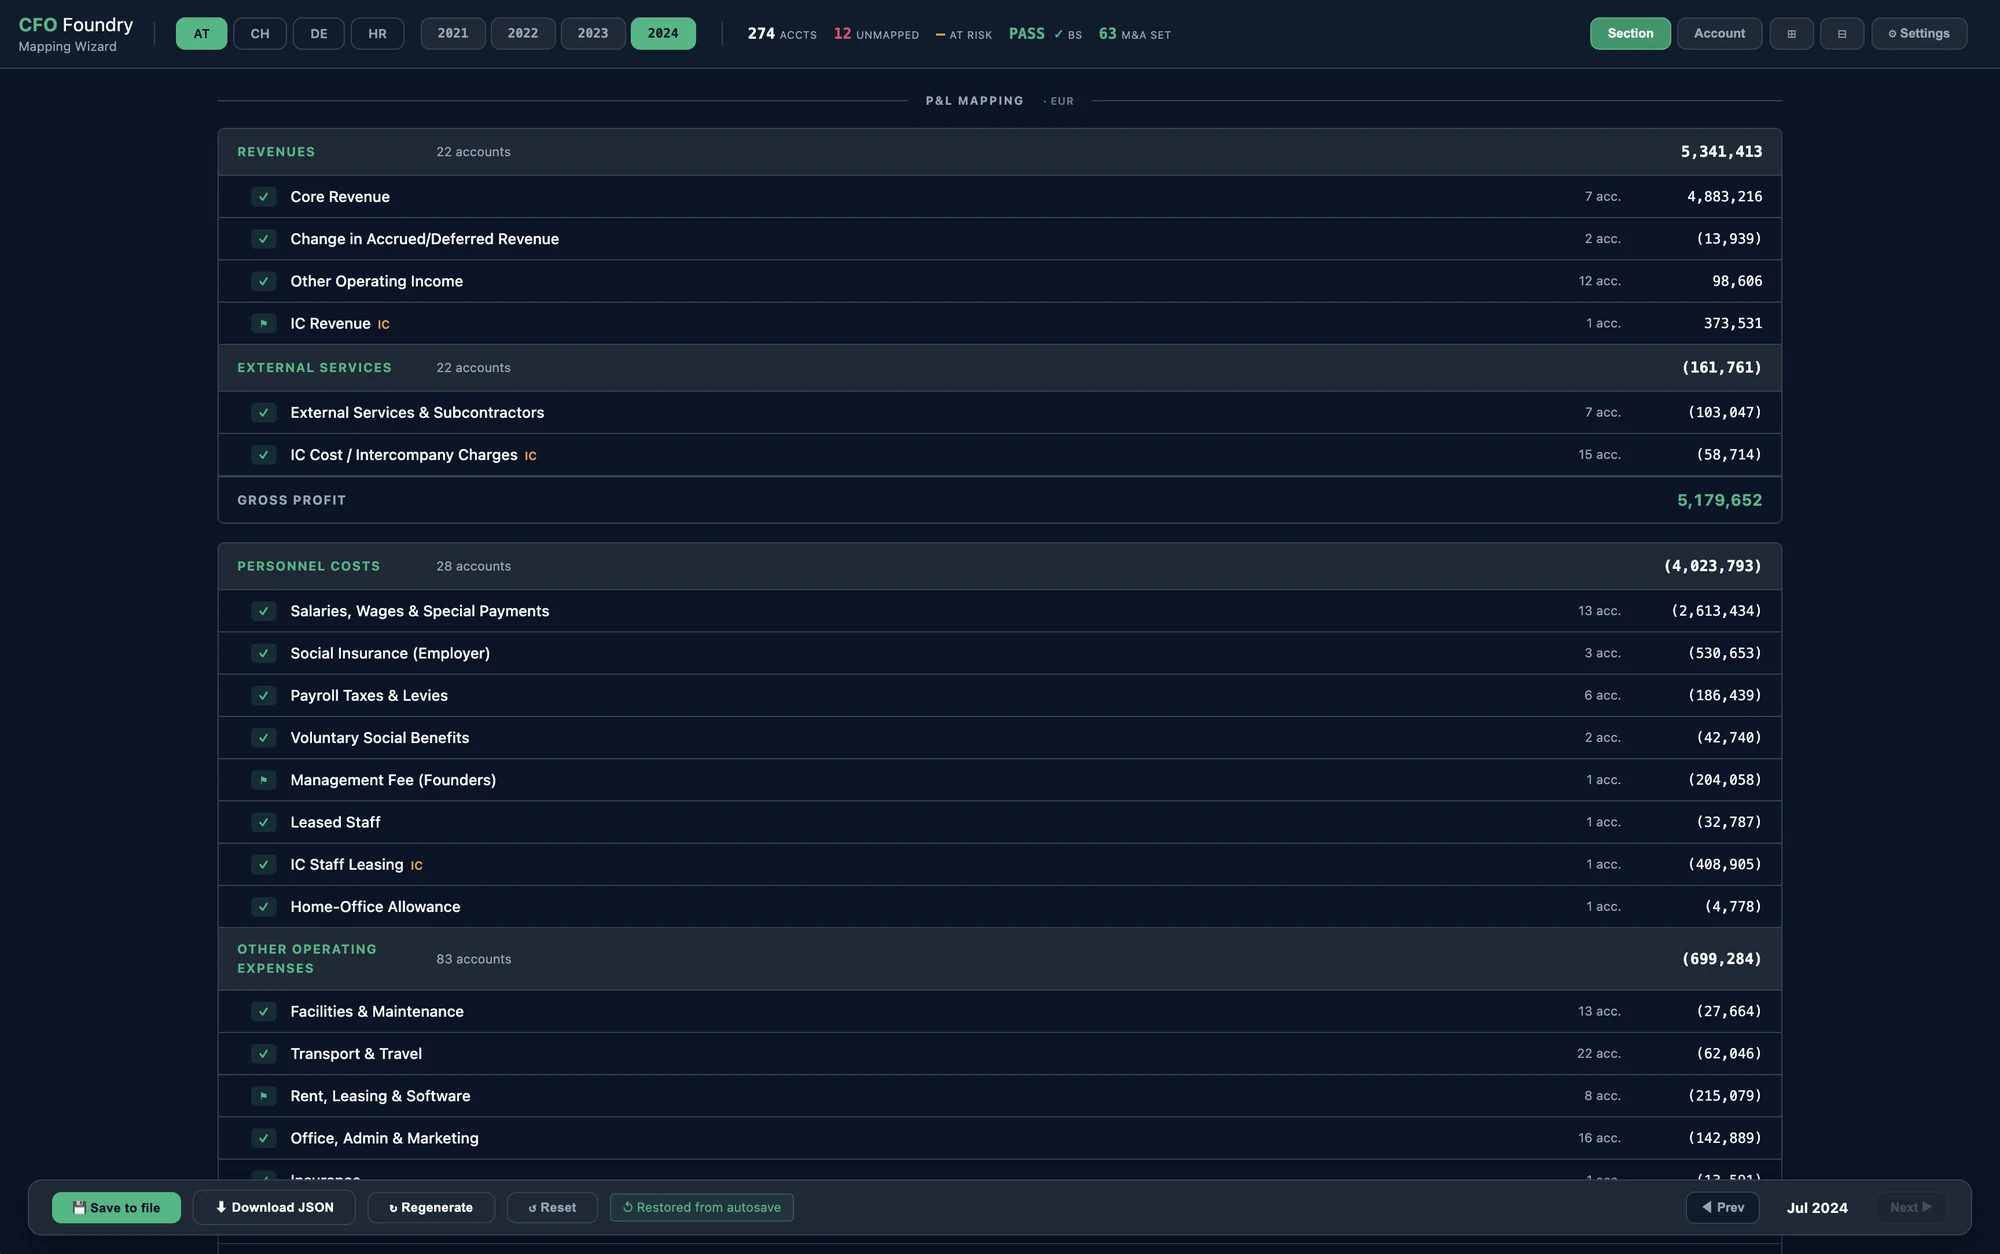
Visual Account Mapping Wizard
No coding, no config files. The visual wizard shows every account from your trial balance and lets you drag it into the right P&L line or BS category. Click, assign, done.
- Works with any chart of accounts, mapped once, per entity
- One-time setup per entity, persisting as JSON
- Handles IC accounts, NWC flags, debt categories
- Unmapped account warnings with guided resolution
Meridian is a fictional demo company. All figures are sample data.
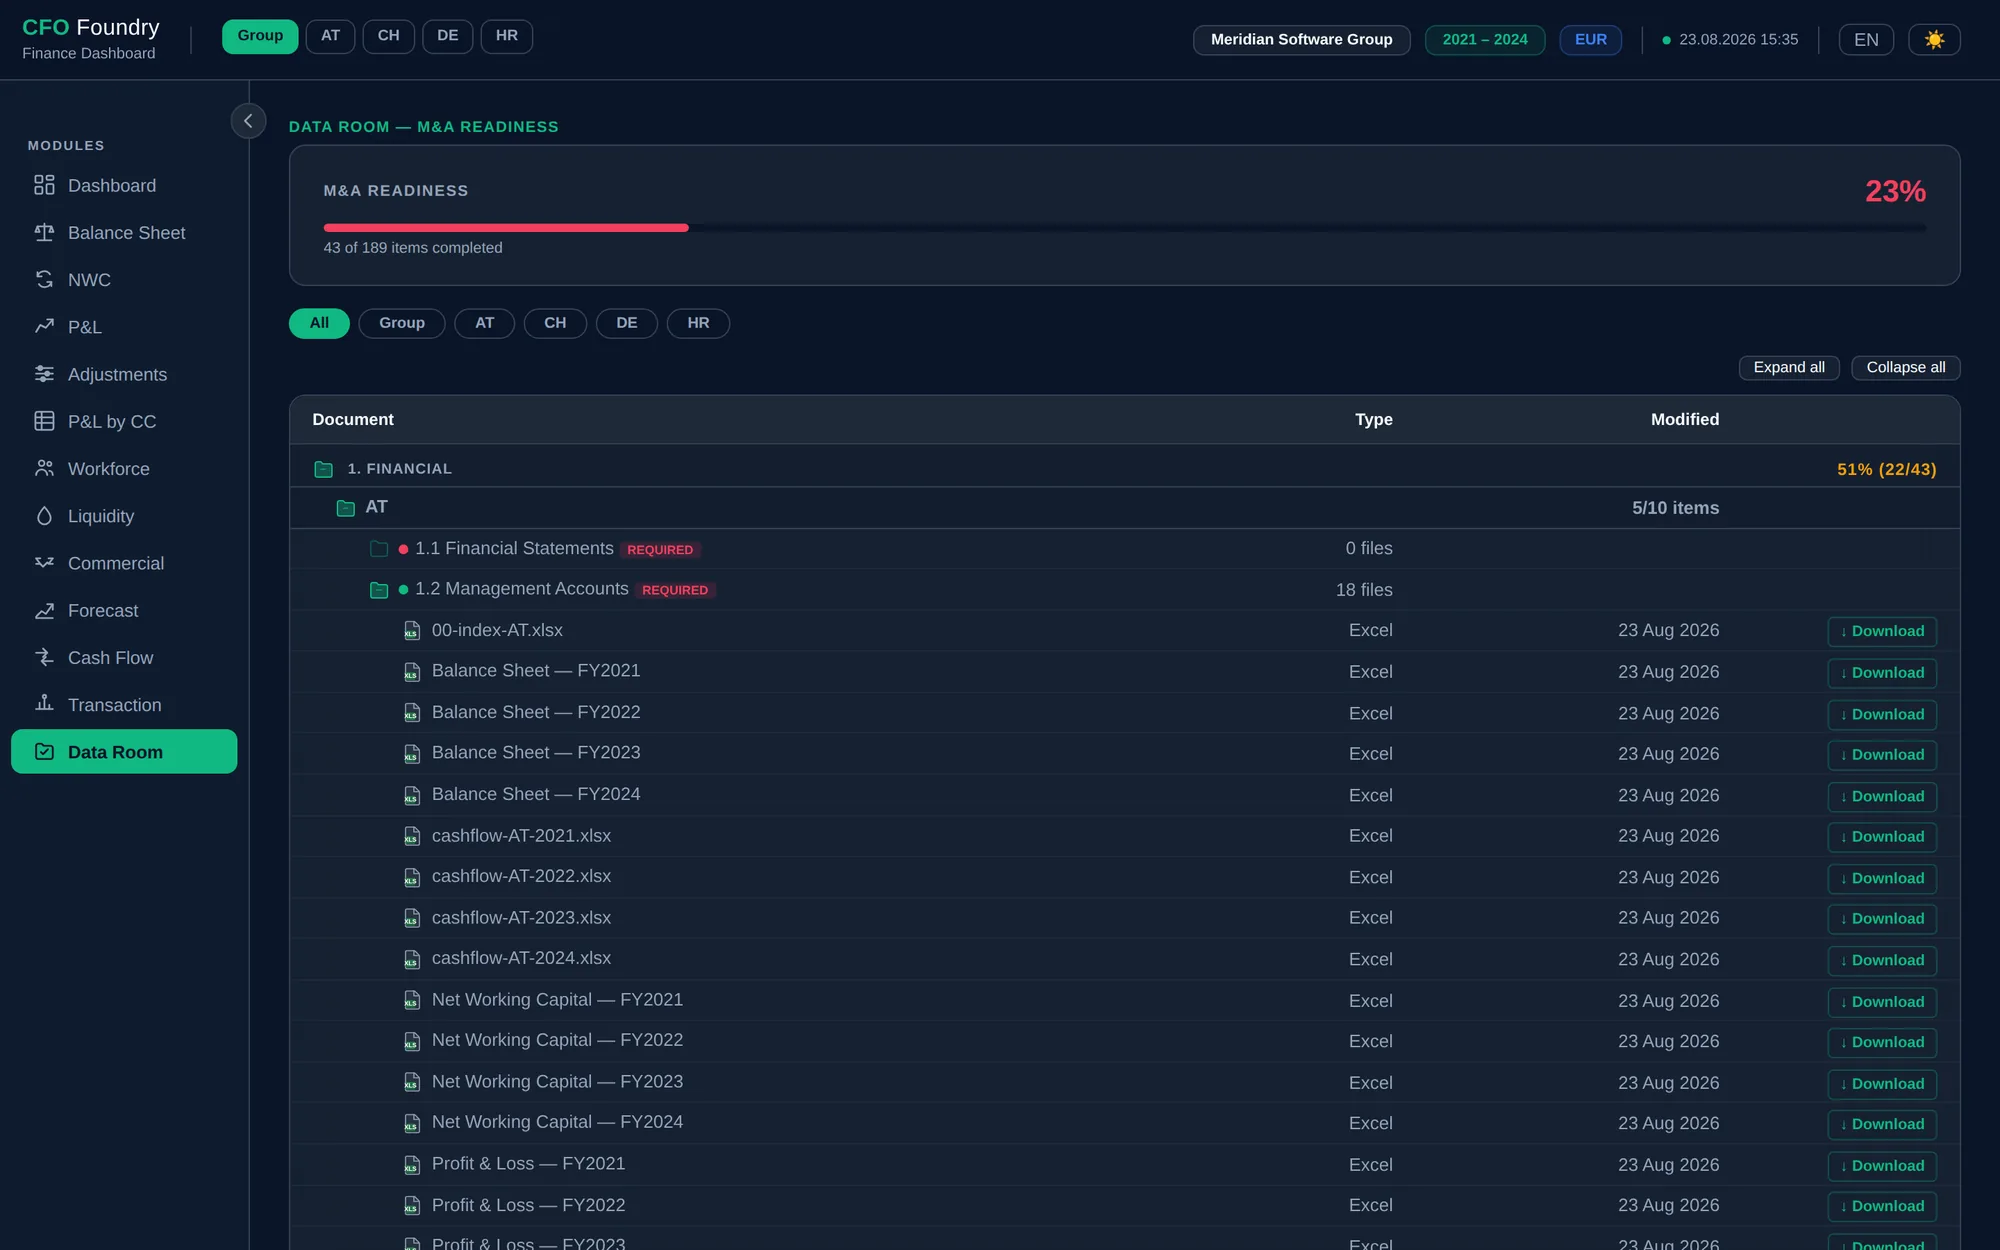
Data Room Readiness
Built-in VDR checklist with 7 sections and 30+ items. Auto-detects your CFO Foundry outputs. Shows exactly what's missing before DD starts.
- Financial, Legal, HR, Commercial, IT, Insurance
- Per-entity and group-level tracking
- Download links and friendly file names
- Overall readiness percentage
Meridian is a fictional demo company. All figures are sample data.
13 modules · 40+ KPIs · in-depth feature walkthrough
Balance Sheet
Monthly BS with sparkline trends, collapsible sections, and balance check badge.
Net Working Capital
NWC by category with account drill-down. Trade receivables, payables, provisions.
Cash Flow
Indirect method. Operating, investing, financing with distributions and CapEx.
Liquidity
Cash positions, financial debt, net cash, credit facilities, available liquidity.
Consolidated
Multi-entity consolidation with IC elimination. Entity comparison. Group views.
YoY Comparison
Revenue, EBITDA, GP, NWC overlaid across all fiscal years. Seasonality visible.
Excel Exports
Summary + Detail tabs with live formulas, charts, branded headers.
PowerPoint Deck
On-demand M&A deck with charts. Entity comparison. Native editable objects.
Every view your business needs
From daily dashboards to sell-side data rooms. See the full breadth of CFO Foundry's reporting.
Meridian is a fictional demo company. All figures are sample data.
Four deliverables. One command.
Every output generated from your trial balance data. Under 10 seconds.
HTML Report
Self-contained file. Dashboard, P&L, BS, NWC, CF, QoE, all interactive with tooltips.
Excel Files
Summary + Detail tabs per view. Live formulas. Charts with data labels. Branded headers.
PowerPoint Deck
10-slide M&A deck. Revenue & EBITDA charts. Entity comparison. Editable objects.
Data Room Checklist
30+ item VDR tracker. Auto-scans your files. Shows what's missing for due diligence.
Three steps. No server. Your data stays with you.
Runs locally. No cloud, no subscription, no data leaving your machine.
Drop Your Trial Balances
Monthly XLSX from your accounting system. Austrian BMD, Swiss KMU, Portuguese SNC.
Map Your Accounts
Visual wizard assigns accounts to P&L and BS categories. One-time setup per entity.
Generate Reports
One command builds everything. HTML, Excel, PowerPoint, Data Room check.
intake · data room · engine · output · and why it comes with an operator
CFO Foundry comes with an operator
What you see on this page is real output, but it is not self-service software. It is an engine plus a working method, currently run by the CFO who built it. Two pages explain the model.
Platform & Method
What CFO Foundry is, how the Foundry works: sources, data room, engine, output, all on premise, and why there is no download link. Where it comes from, and whether it will become a product.
Platform & Method →How an engagement runs
The work itself, hands on: five stages from assessment to transaction readiness, each ending in something you can hold. Fractional, a few days a month, never a permanent seat.
The engagement, stage by stage →You're probably wondering...
Why not just use Excel?
You can. Until you need 3 years of monthly P&L across 3 entities with IC elimination, adjusted EBITDA, and a data room checklist. CFO Foundry generates all of it from one command. Excel can't.
Why local, not cloud?
Trial balances contain every account in your company. CFO Foundry runs on your machine. No uploads, no SaaS provider seeing your numbers, no subscription fees.
How is this different from SaaS tools?
Fathom, Spotlight, Syft serve bookkeepers. CFO Foundry is built for founders, their leadership teams and M&A: IC elimination, QoE adjustments, Rule of 40, VDR checklist. Different problem, different tool.
Where do I download it?
Nowhere, yet. CFO Foundry is not self-service software. It is a reporting engine plus a working method, and today it comes as part of a fractional CFO engagement. Every report, workbook and data room file it produces stays with you. The full picture: Platform & Method.
Why does it need an operator?
Because CFO Foundry only reports, and the reports are exactly as good as the numbers going in. Behind them is method inside the company: a chart of accounts kept deliberately, bookings that make one month comparable to the next, data delivered on a fixed date. Setting that up and holding it in place is the work of the CFO who brings it.
What data does it need?
More than trial balances. The full picture draws on HR and payroll data, operational hours from time tracking, the sales pipeline and cost centre structures. Part of the engagement is defining, for each source, an owner, a shape and a date in the month it is delivered.
What accounting systems work?
Any system that exports trial balances as XLSX. Currently handles Austrian BMD, Swiss KMU, and Portuguese SNC chart of accounts. Adding new formats takes hours, not weeks.
What does an engagement look like?
Five stages: assessment, implementation, cadence, deepening, transaction readiness. The assessment ends with a first report pack from your existing numbers. From then on the rhythm is monthly, with a few days of a fractional CFO's time, and the discipline stays in the company. The stages in detail: How an engagement runs.
Do I need to be technical to use this?
No. Today you do not operate it at all. Adastra Solutions runs it as part of the engagement. Your team's part is delivering the agreed data each month and working with the output, HTML that opens in any browser and Excel that behaves like Excel. And it is built simple enough that once the continuity licence exists, your lead accounting person can take over the intake and run the generation.
The roadmap ahead
Where it stands at this point: what is done, what is being built now, and what is still an open question.
Net Debt and Working Capital Bridge
Normalised working capital, the peg, and everything that could be argued as debt-like, calculated before a buyer calculates it for you. These move money after the multiple is agreed.
Leverage and Debt Capacity
Net debt to EBITDA, interest cover, and headroom against covenants, monthly rather than discovered at a bank meeting. The same ratio sets how much debt a buyer can raise against the business, which is most of what sets the price they can pay.
Column Mapping for Any Source
The same wizard that maps accounts, applied to the file itself. Assign the columns of whatever your accounting system exports, once per source. No connector to build, no format that cannot be read, and raw data that survives a change of system or owner.
Budgeting
Completes the planning loop: reporting, forecast, budget. Variance against actuals month by month, so a miss surfaces while the quarter can still be changed.
Adjustment Audit Trail
Every add-back timestamped with its evidence at the moment it is booked, not reconstructed a year later. Documented as they occur, add-backs get accepted. Found during diligence prep, they get challenged.
Rolling Twelve Months
Every P&L and EBITDA figure on an LTM basis alongside the fiscal year. Buyers value on the last twelve months, and a company that reports only in fiscal years hands them the job of rebuilding it.
Continuity Licensing
The monthly pack does not stop when the engagement does. A licensed parser lets your team keep producing the same reports from the same data room.
Project and Engagement Margin
Contribution per project and per client during the month, not after the quarter. For a business whose product is people's time, this is where margin is made or lost.
Concentration and Retention
Top ten concentration, net revenue retention, and churn, tracked monthly. Concentration is the first thing diligence asks about a service business and the last thing most leadership teams can answer from a system.
Stakeholder Views
The same numbers cut for the reader: a one page view for the CEO, a board pack, a lender pack. One set of figures, three audiences, no parallel spreadsheets.
Snapshots and Version History
Every month's pack archived and restorable, so you can show what was known when. Useful for a board, necessary in a data room.
Cloud Option
On-premise first. Your data stays with you. A hosted option is being evaluated for teams that want shared access without local setup.
Ready to see your numbers clearly?
Whether you need operational KPIs, sell-side preparation, or both, tell us about your situation and we'll get back to you.
CFO Foundry is currently deployed as part of Fractional CFO or M&A Advisory engagements with Syrous Abtine.
Thank you!
Your inquiry has been received. You’ll have a reply within 1–2 business days.

100+ employees, 3 countries
PE exit, 2024
A founder since 2001
Syrous Abtine co-founded Parkside in 2007 and ran it for seventeen years: custom software engineering and digital services, more than 100 people, offices in Austria, Portugal and Switzerland. He was Managing Partner and Group CFO, and in 2024 led the financial workstream of its sale to a UK private equity buyer. Before that, from 2001 to 2006, a digital studio in Graz called Mediaeffect.
Adastra Solutions is the most recent company, where twenty years of building digital products and software meet the finance, M&A and infrastructure work that running those companies required. Adastra also helps companies put AI to work in their finance function, from producing the monthly numbers to the analysis behind a decision. He runs every CFO Foundry engagement himself.