Cash forecast and EBITDA forecast
How much cash there will be in each of the next 26 weeks, and what the work already in the pipeline earns against what the team could deliver.
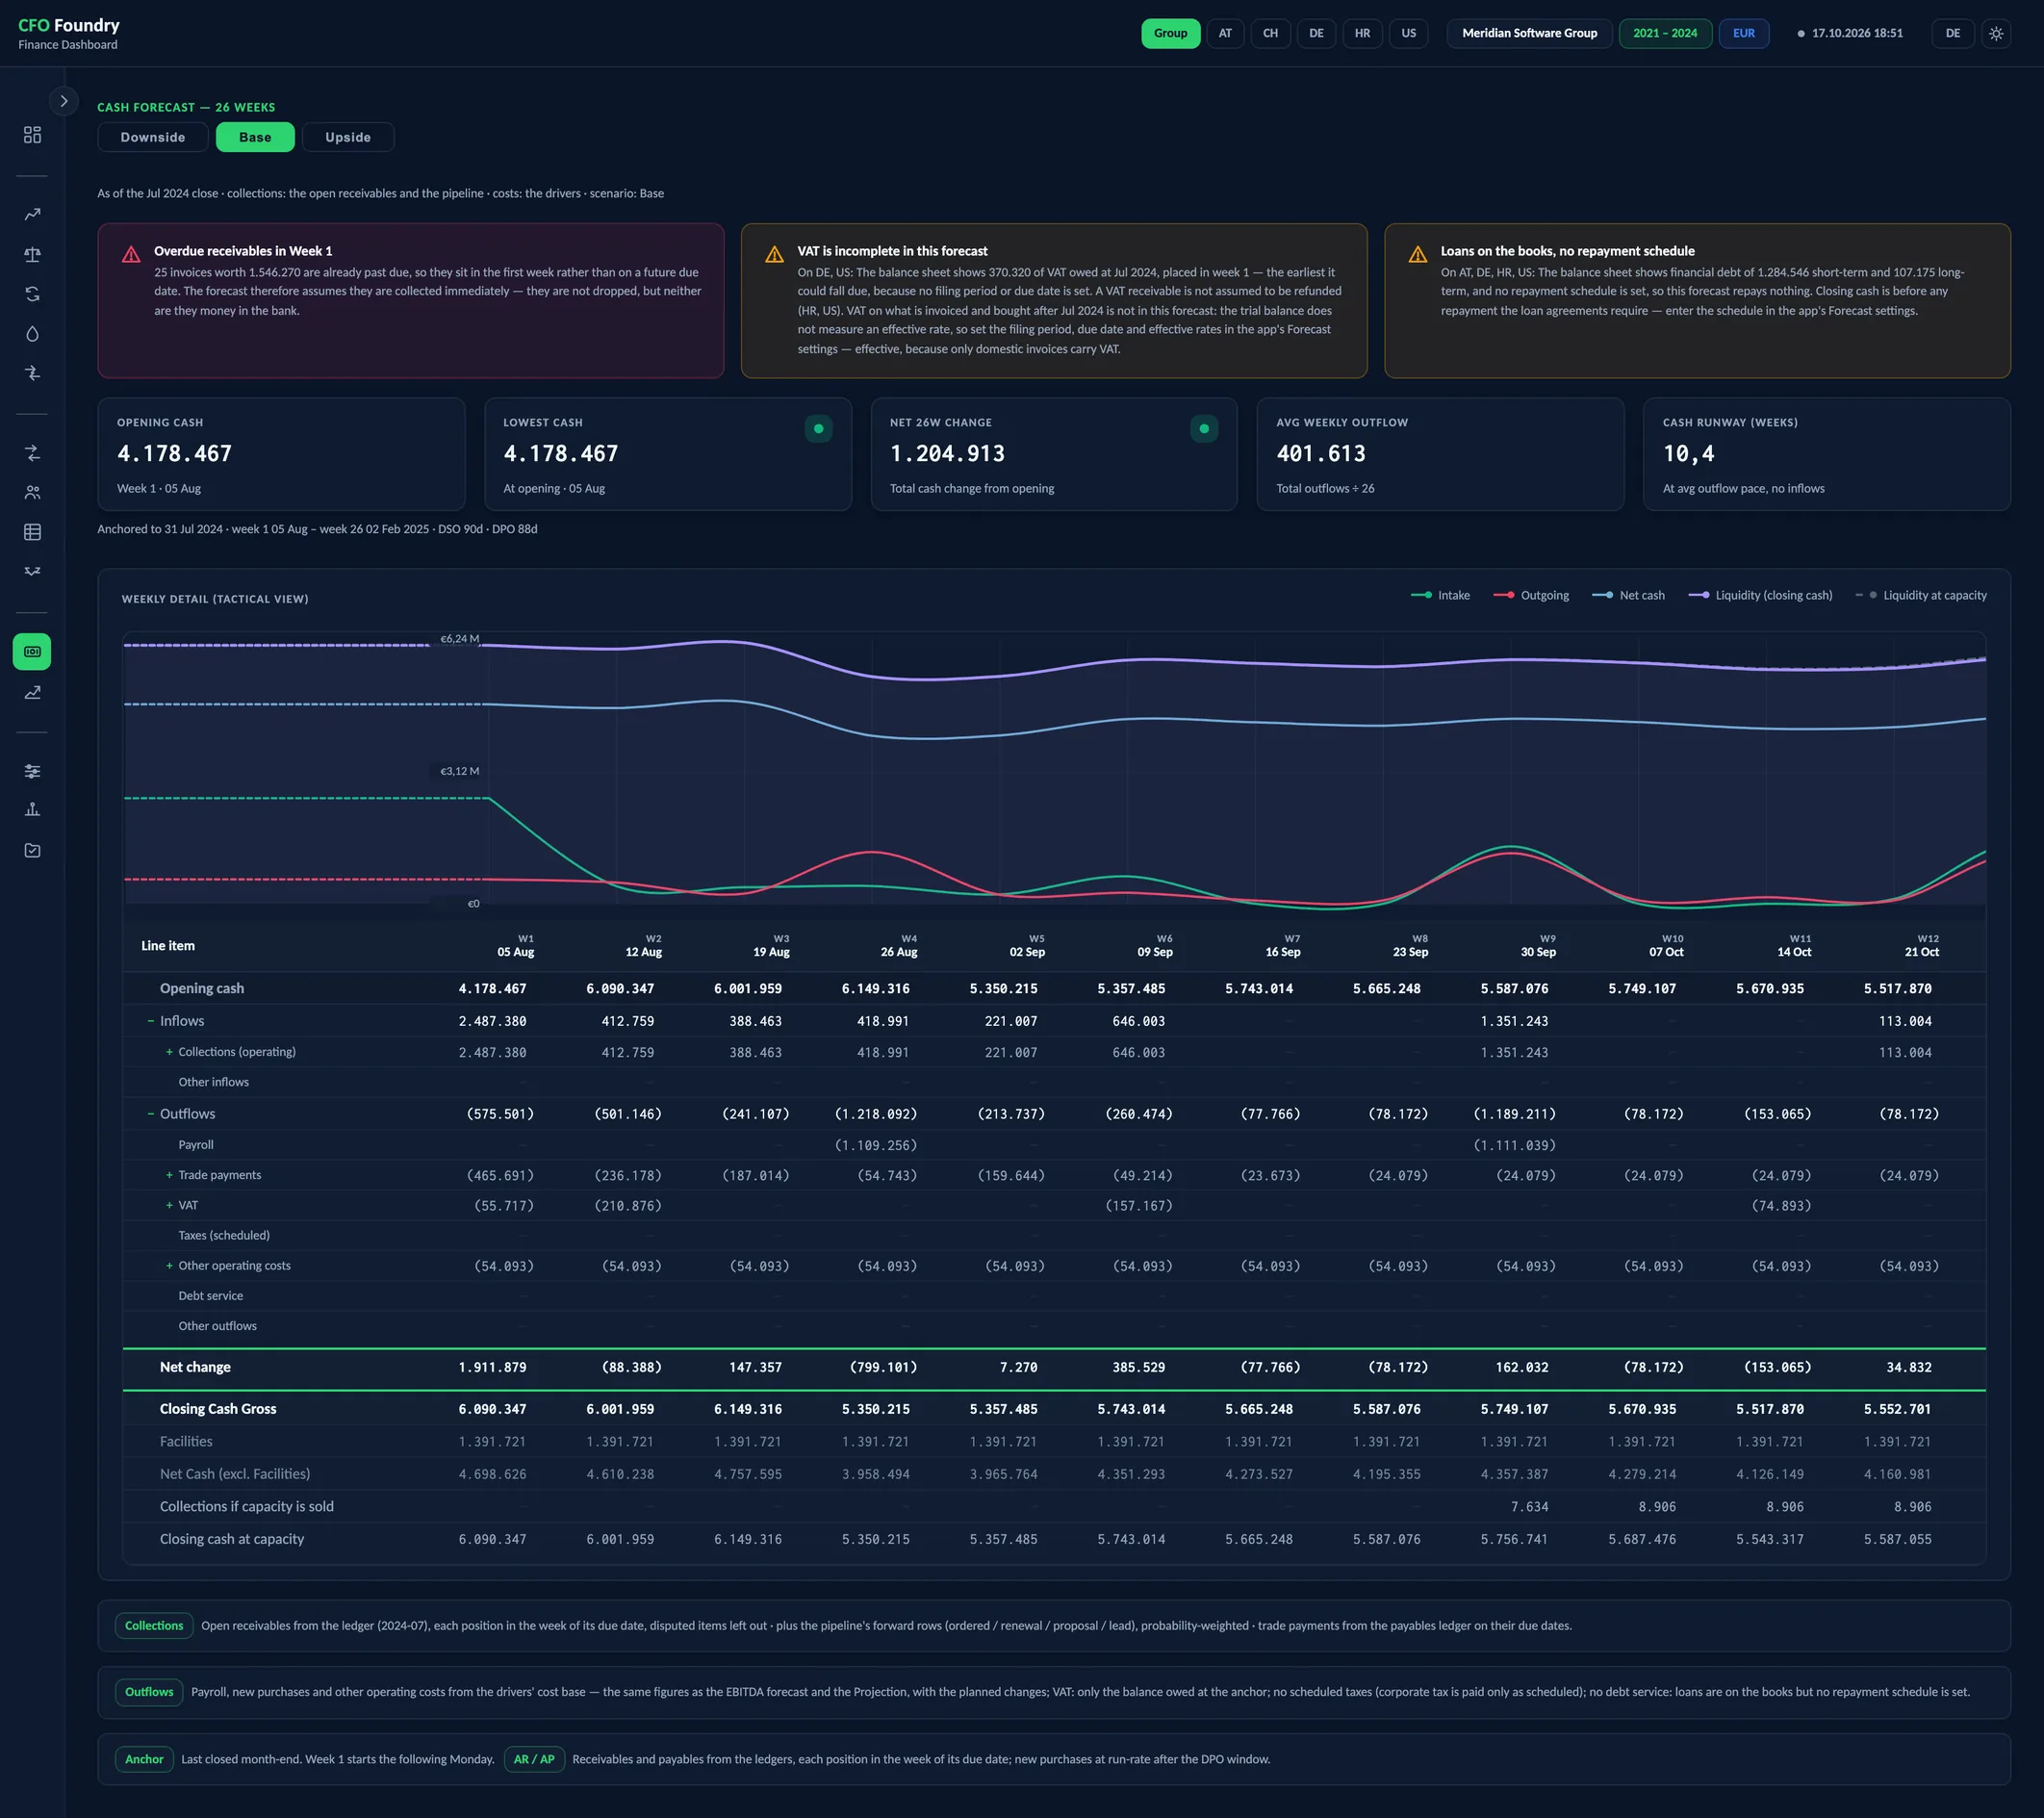
- 5 KPIs
- Weekly detail (tactical view)
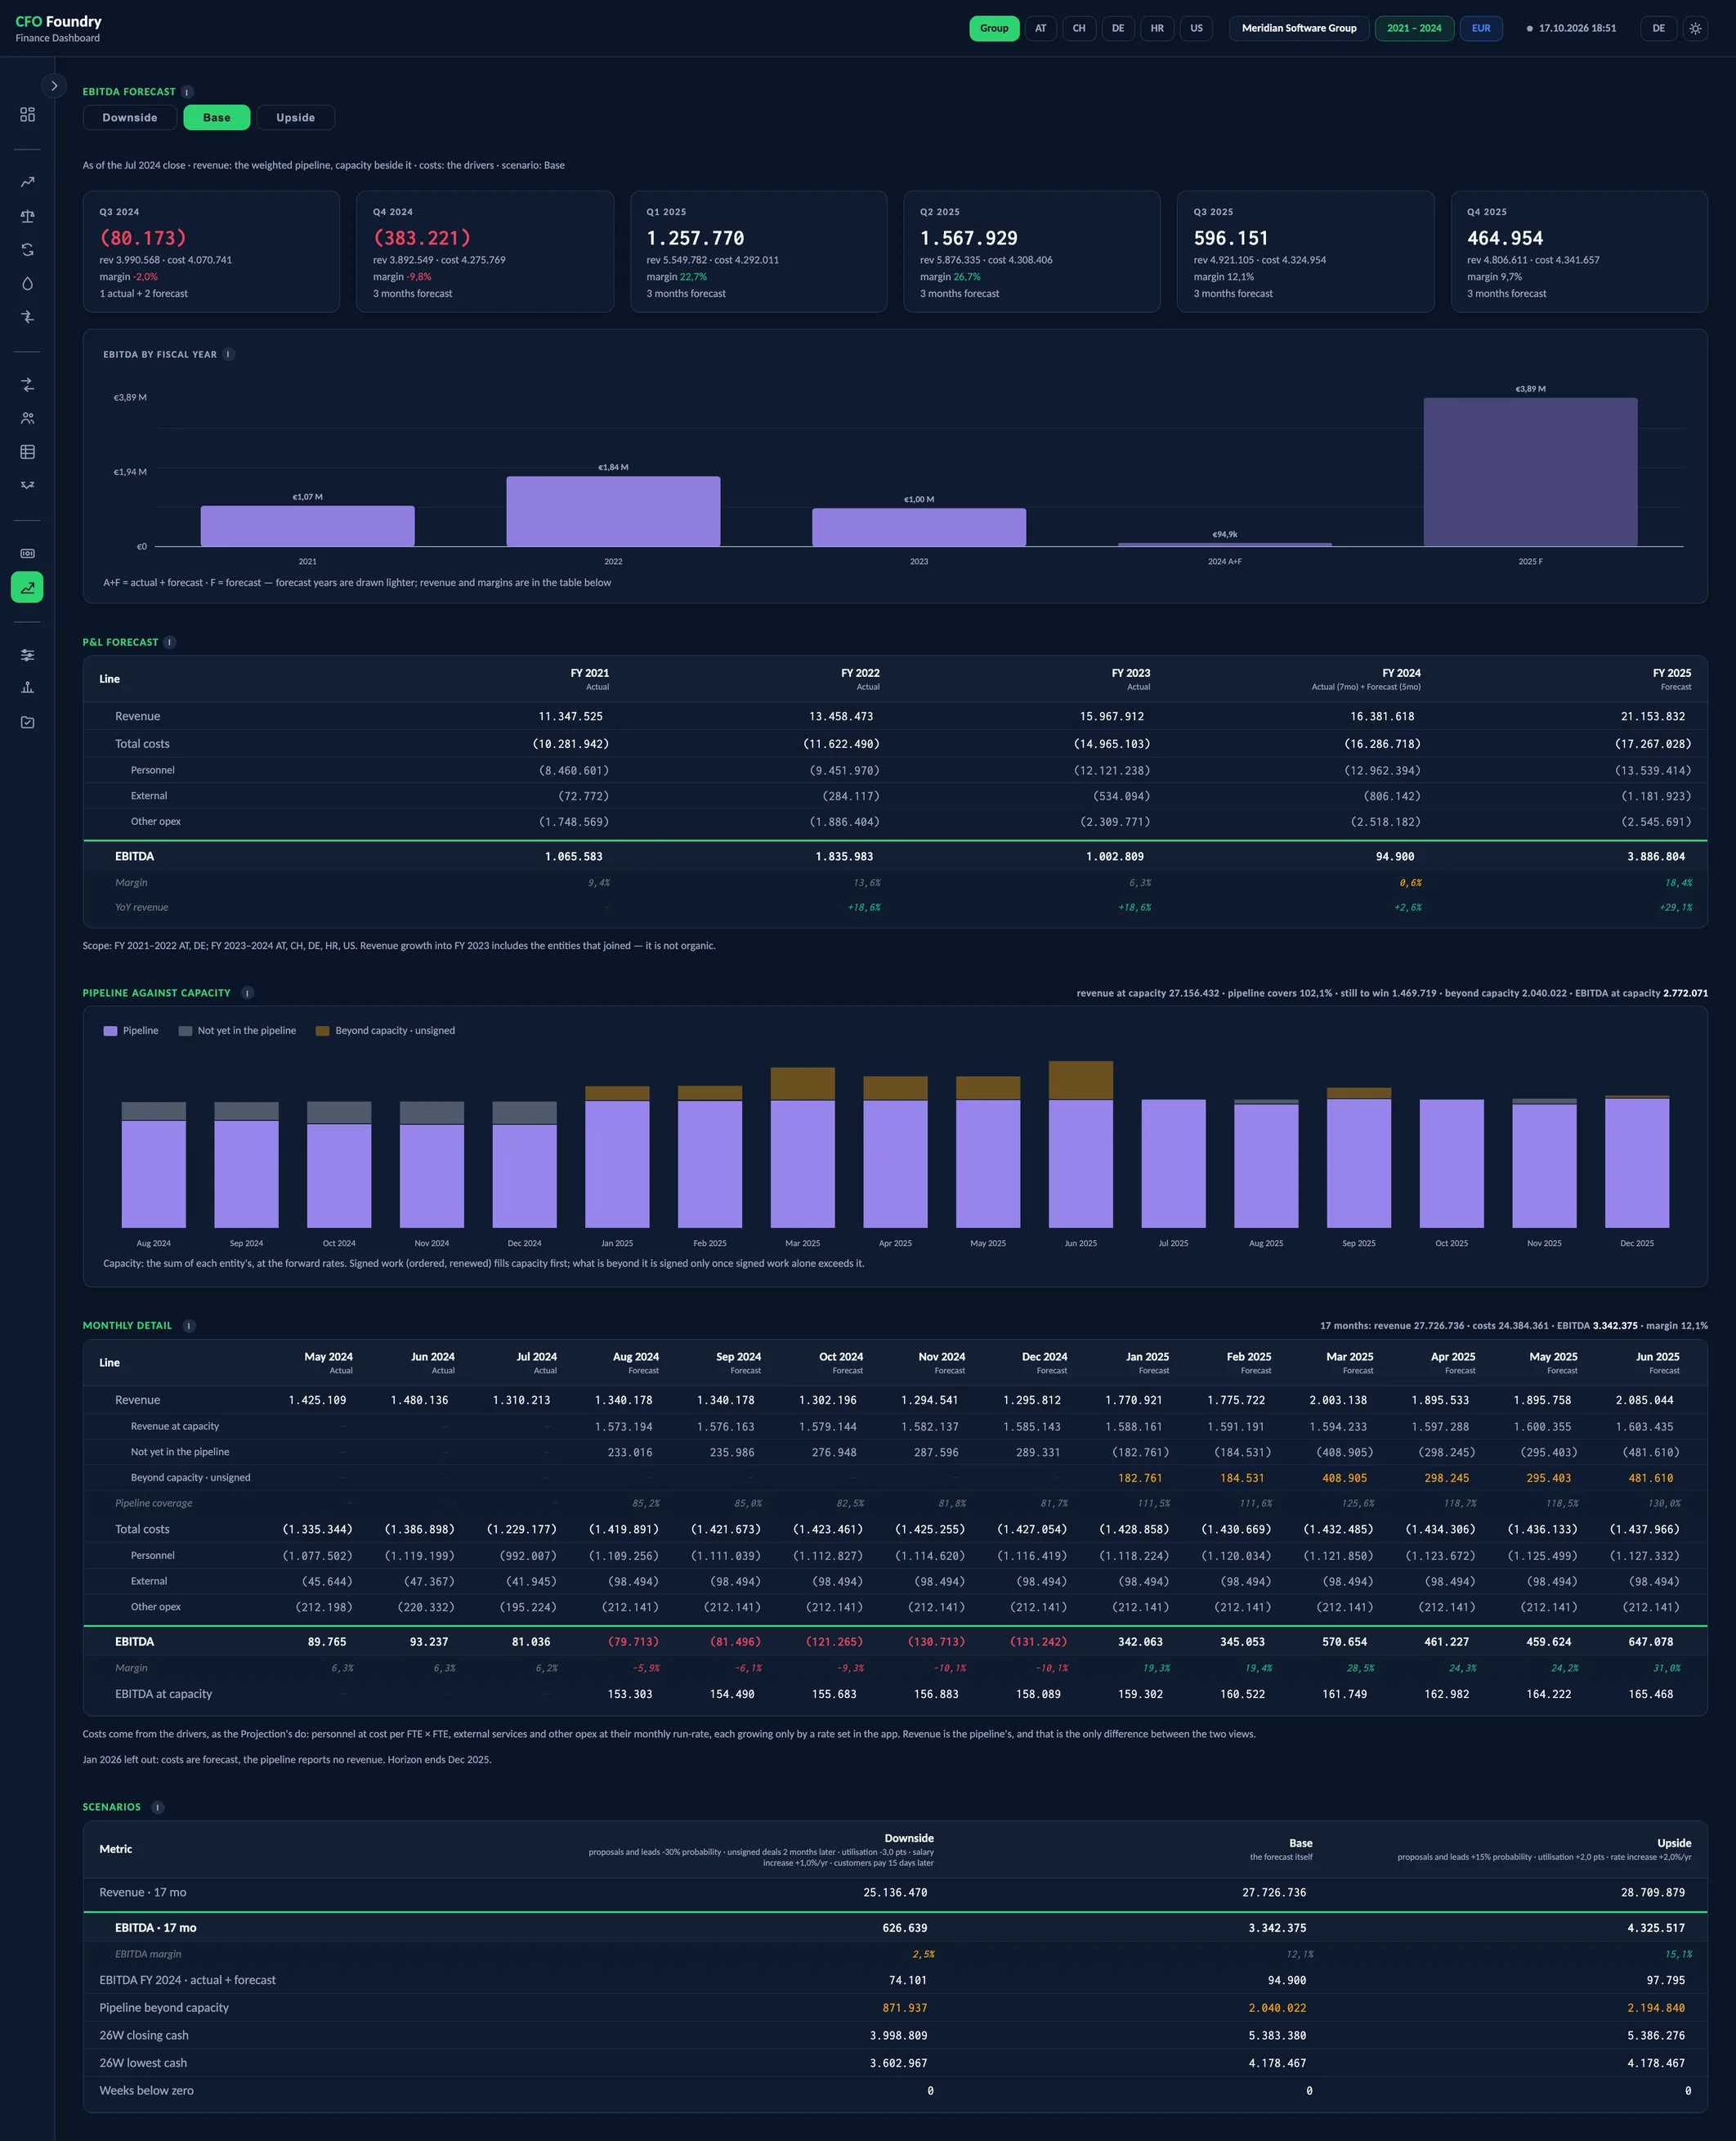
- P&L FORECAST
- MONTHLY DETAIL
- SCENARIOS
Meridian is a fictional demo company. All figures are sample data.
Key questions
Will the cash last?
The lowest closing cash and its week stand at the top, beside the runway in weeks at the average weekly outflow.
Where will the cash come from?
Collections come from the invoices already sent and from the deals in the pipeline.
What does the pipeline earn?
The EBITDA forecast sets the weighted pipeline against the cost base month by month, with the revenue the team could deliver at capacity beside it.
26 weeks of forward cash
A direct 26-week cash forecast. Collections come from open receivables and the weighted pipeline; payments from the cost drivers, the loan schedule, VAT and planned cash items. Every line opens to a row per client or supplier. Lowest closing cash and runway in weeks stand at the top.
The months both pipeline and costs report, with revenue in layers: what the pipeline covers, what capacity could earn, and what is not yet in the pipeline. Costs come from the same drivers as the cash forecast.
Cash 26W
- Downside
- Base
- Upside
- Opening cash
- Lowest cash
- Net 26W change
- Avg weekly outflow
- Cash runway (weeks)
- Weekly detail (tactical view)
- Weekly detail (tactical view)
EBITDA
- Downside
- Base
- Upside
- EBITDA by fiscal year
- Pipeline against capacity
- P&L forecast
- Monthly detail
- Scenarios
Platform
- Drivers and Planned Changes: A hire, a lease or a one-off entered once with its month; every forecast takes it from there.
Week by week, line by line
The forecast opens with the cash at the last close. For each of the next 26 weeks it shows what comes in, what goes out and the cash at the end of the week, each on its own line:
- Collections from clients and other inflows
- Payroll
- Payments to suppliers
- VAT and scheduled taxes
- Other operating costs
- Debt service and other outflows
Each line opens into one row per client, supplier or named item. A week's cell lists the invoices or deals behind it, a deal with its stage and probability. Payroll stays one figure.
The page also flags overdue receivables and a gap between how fast clients actually pay and their payment terms.
What is measured and what is stated
Costs come from the drivers measured in the company's own history. A hire, a lease or a one-off is entered once as a planned change with its month, and every forecast takes it from there.
Loan repayments follow the schedule set in the forecast settings. Where the balance sheet shows financial debt without a schedule, the page says that closing cash is before repayment.
VAT and corporate tax are paid in the weeks they fall due.
EBITDA against capacity
The EBITDA forecast sets the weighted pipeline against the same cost base as the cash forecast, month by month.
Beside the pipeline stands the revenue the team could bill at capacity. The chart stacks three layers:
- The pipeline within capacity
- Capacity not yet in the pipeline: a sales question
- Pipeline beyond capacity, signed and unsigned: a delivery question
EBITDA is stated twice over the same costs, on the pipeline and at capacity. A monthly table opens with the latest closed months, and a fiscal-year table sets the forecast beside the year's actuals.
In the cash forecast, two memo rows and a dashed line show the cash if capacity were sold. Where scenarios are set, both forecasts carry a tab per scenario and switch together.
Terms
- Direct Method
- A cash forecast built from expected receipts and payments, each on its date.
- Cash Runway
- Opening cash divided by the average weekly outflow, with no inflows: how many weeks the cash would last.
- Capacity Revenue
- The revenue the team could bill with its capacity fully sold.
- Pipeline Coverage
- The weighted pipeline of a month as a share of that month's capacity revenue.
- Planned Change
- A dated fact about the future, such as a hire, a cost from a month or a one-off payment, applied from its date.
Data sources
- The receivables and payables ledgers at the last close
- The pipeline export, from the CRM or ERP
- The drivers measured from the trial balance, headcount and hours
- Planned changes and the forecast settings
FAQ
What does a 13-week or 26-week cash forecast show?
The cash expected at the end of each week, after everything due to come in and go out, so a shortfall shows while there is still time to act. The forecast in CFO Foundry runs 26 weeks.
Can a cash forecast be built from accounting data?
Yes. CFO Foundry builds it from the exports the company already has, and every line opens to the clients and suppliers behind it.
How is cash runway calculated?
Opening cash divided by the average weekly outflow of the forecast, assuming no further inflows. The result is a number of weeks.
Why compare the pipeline with capacity?
The pipeline thins out the further a month lies ahead, while costs continue. Capacity shows what the team could earn in the same months, so a shortfall reads as work still to win.
Get in touch
Describe your situation in a few lines. A reply typically follows within 1–2 business days.
To the Contact Form