Departments and internal hourly rates
What each department earns and costs, and what an hour has to sell for to carry the people and the overhead.
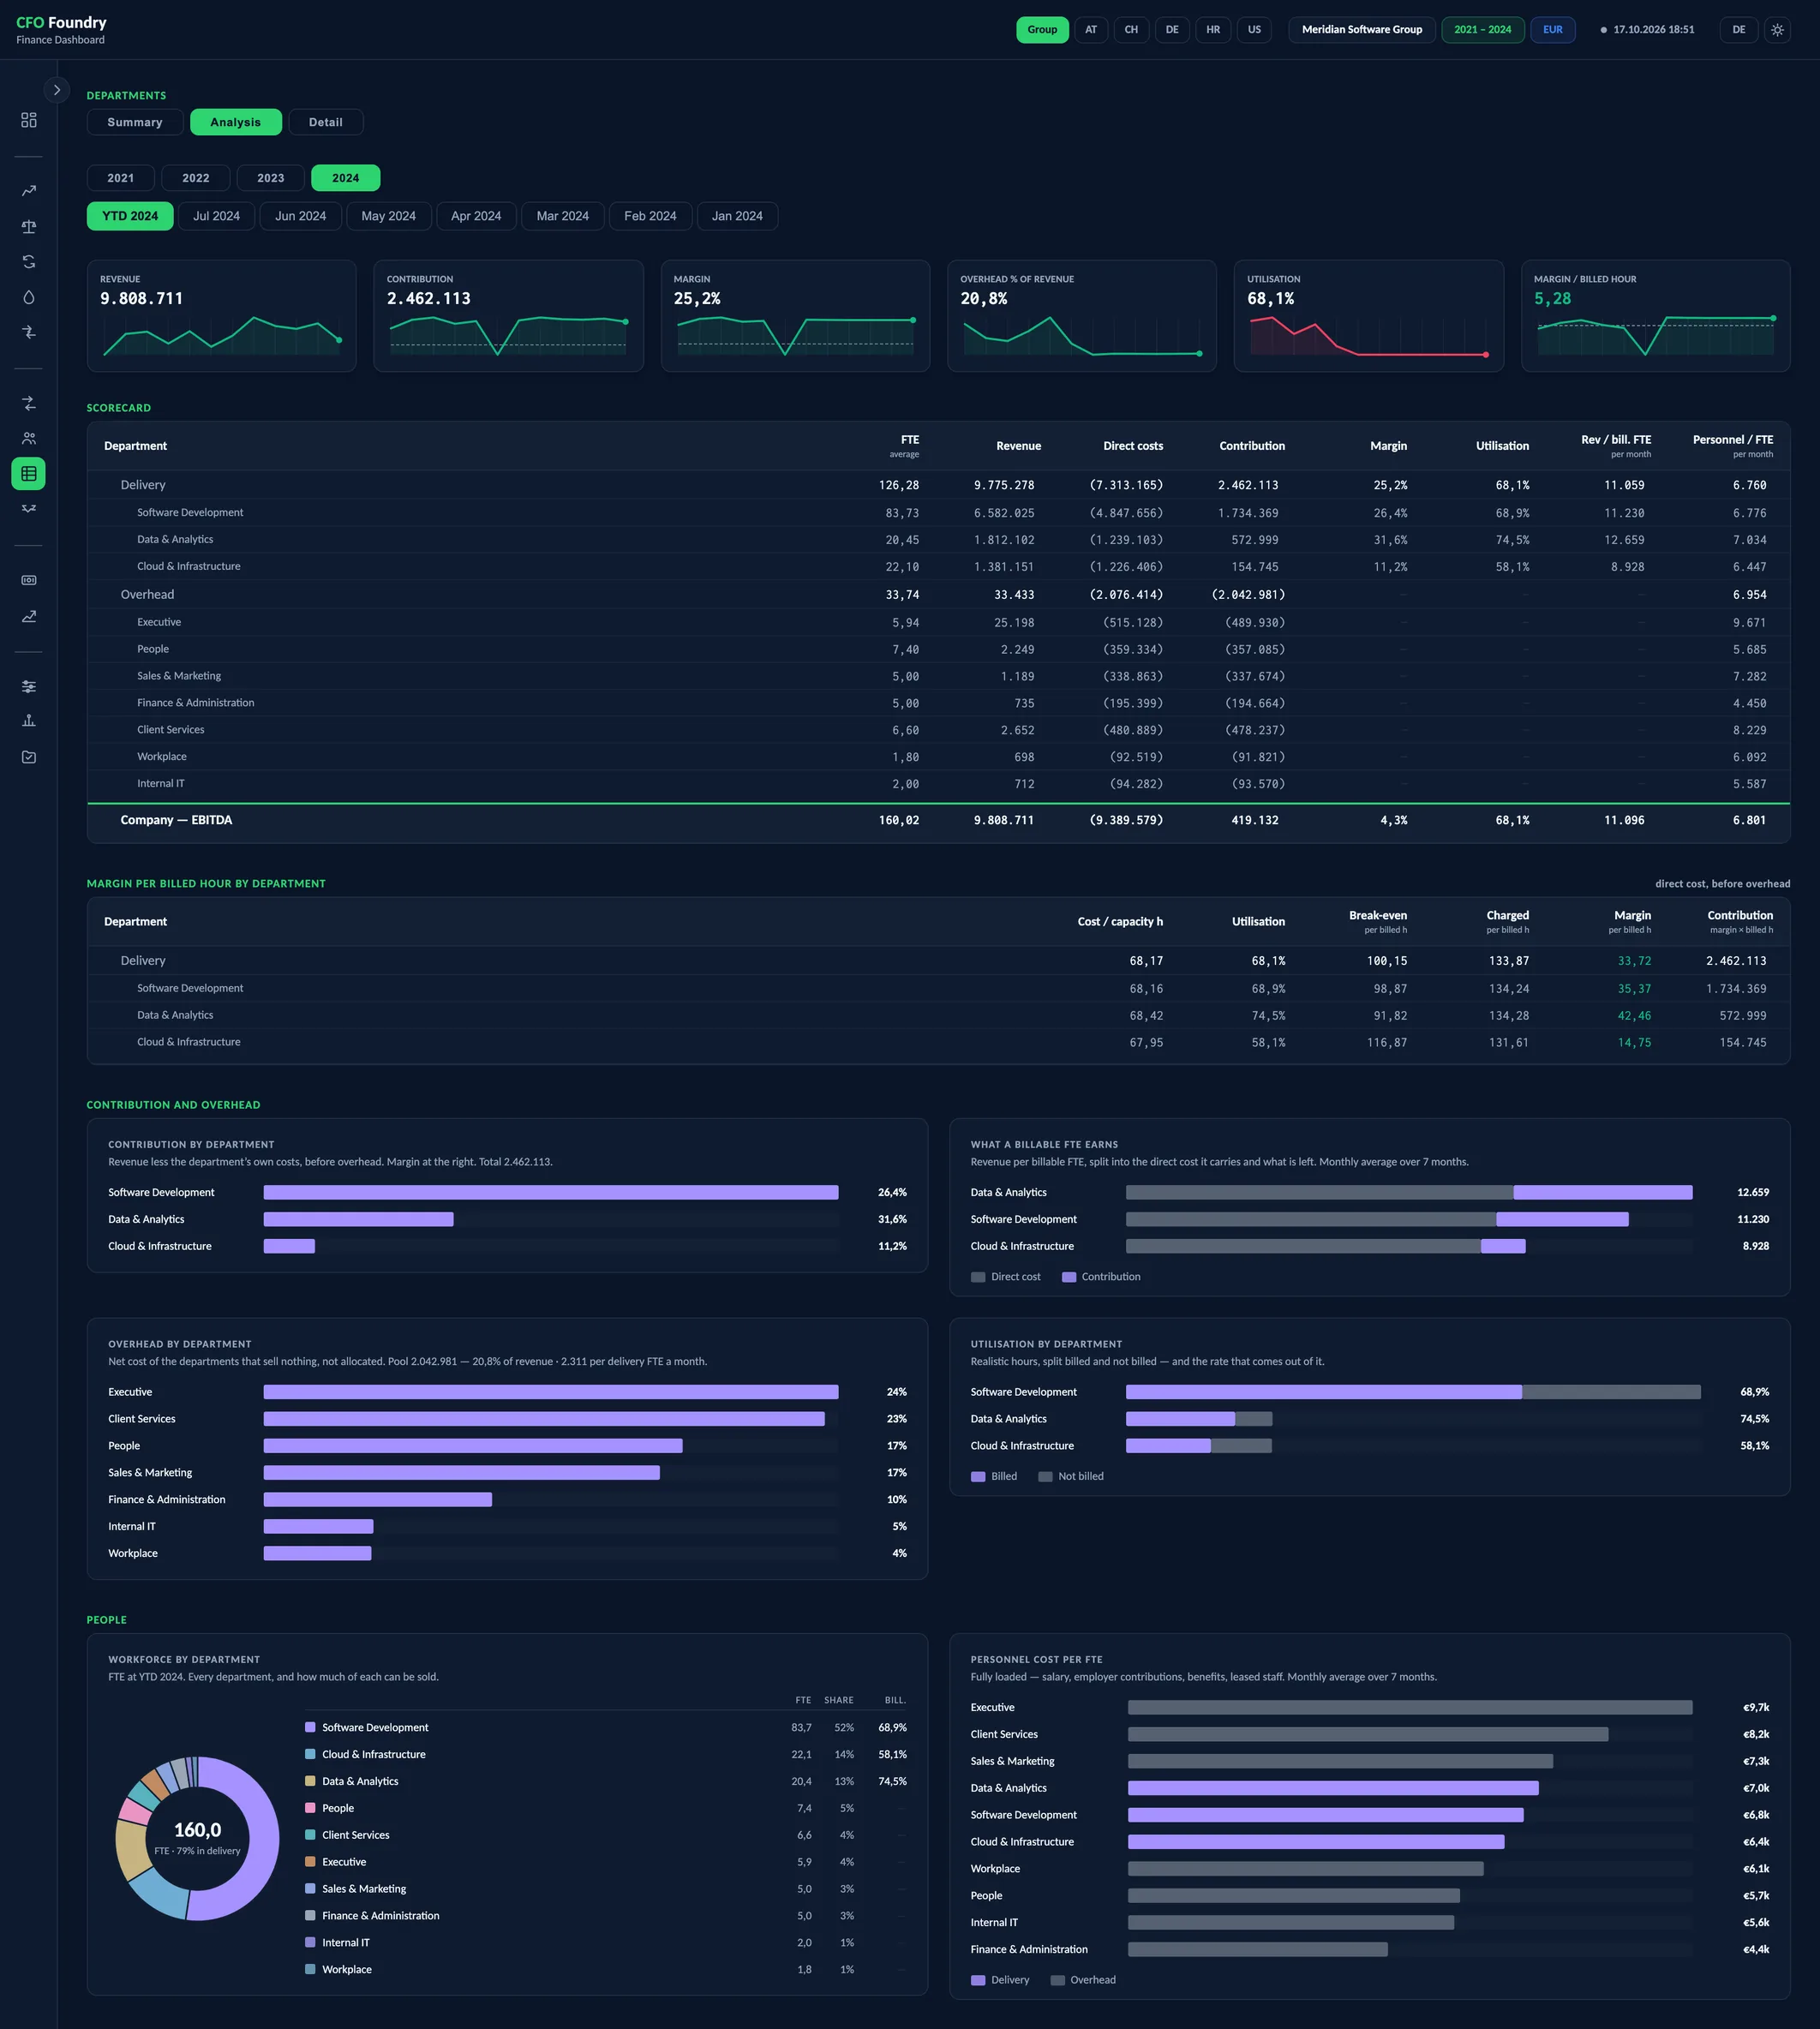
- 6 KPIs
- SCORECARD
- MARGIN PER BILLED HOUR BY DEPARTMENT
- Contribution by department
- What a billable FTE earns
- Overhead by department
- Utilisation by department
- Workforce by department
- Personnel cost per FTE
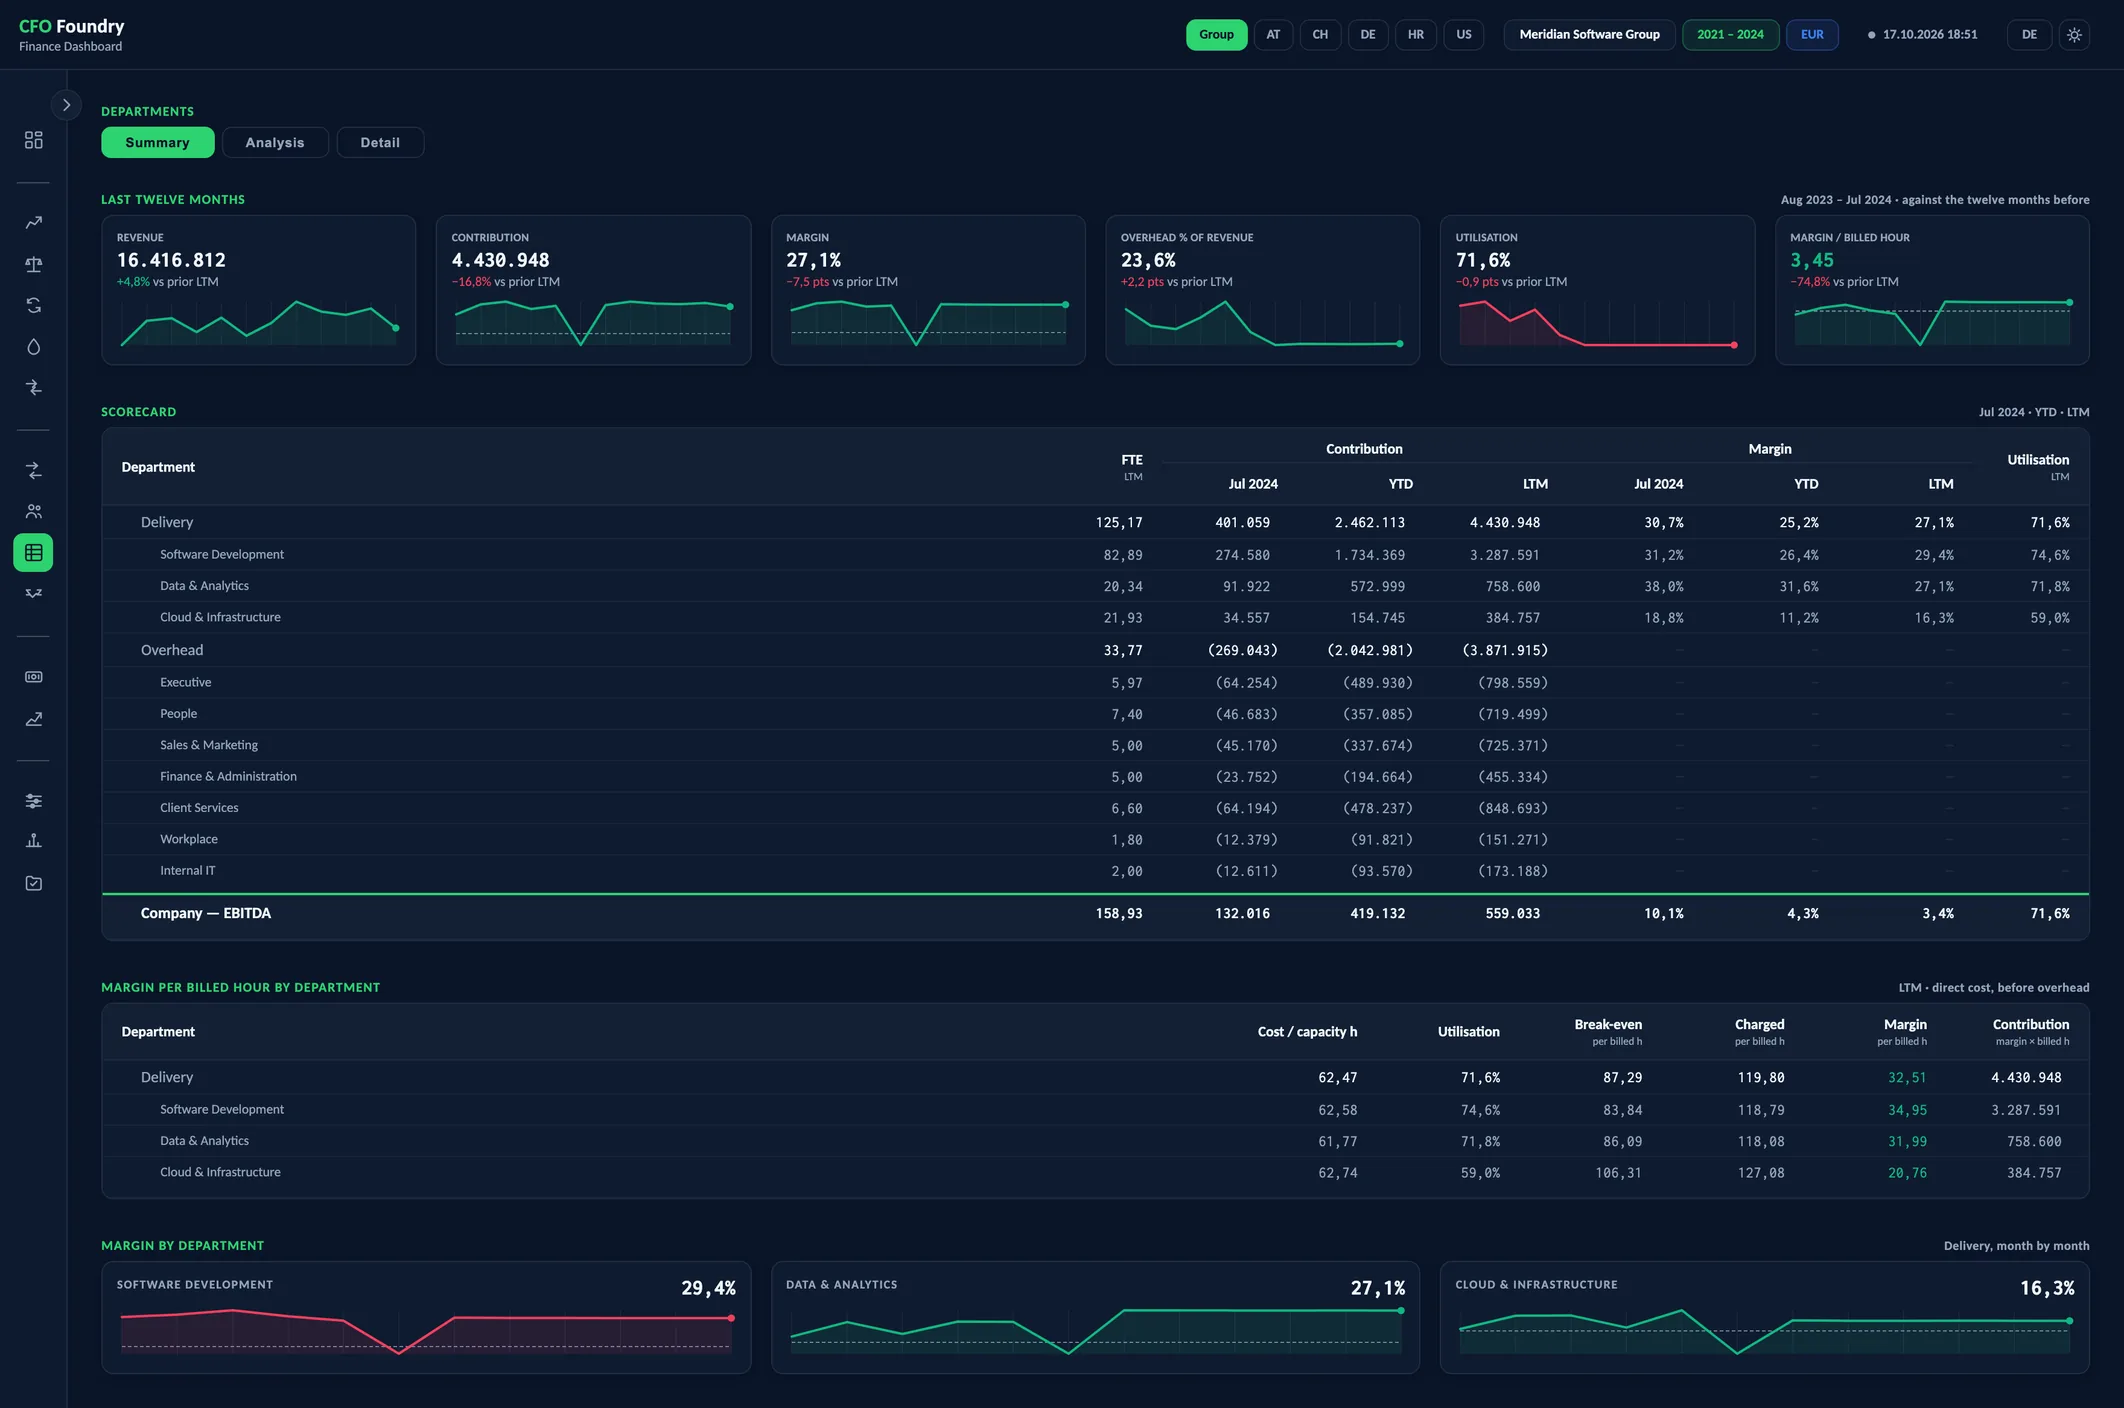
- 6 KPIs
- SCORECARD
- MARGIN PER BILLED HOUR BY DEPARTMENT
- MARGIN BY DEPARTMENT
Meridian is a fictional demo company. All figures are sample data.
Key questions
What does each department contribute?
Contribution is a department's revenue less its own direct costs, with the margin and utilisation beside it.
What does an hour cost?
Cost per capacity hour is what an hour of the delivery team's capacity costs, with the overhead it carries.
What must an hour sell for?
The break-even rate is what a billed hour must bring in to cover the cost, and the margin per billed hour is what the charged rate earns above it.
What each department earns, and what an hour costs
A scorecard per department, then its contribution after costs. Available hours run down through absence and unbilled time to the hours invoiced. Cost per capacity hour divided by utilisation gives the break-even rate; the margin per billed hour is what remains above it.
Departments
- Summary
- Analysis
- Detail
- Revenue
- Contribution
- Margin
- Overhead % of revenue
- Utilisation
- Margin / billed hour
- Contribution and overhead
- People
- Scorecard
- Margin per billed hour by department
- Internal hourly rates
- P&L by department
- People and hours by department
Contribution by department
The cost-centre P&L carries every department's revenue, personnel, external services and other operating costs. Contribution is the department's revenue less those costs, and the margin is contribution over revenue.
The scorecard lists every department with FTE, revenue, direct costs, contribution, margin, utilisation, revenue per billable FTE and personnel cost per FTE. Delivery and overhead are sections carrying their own totals, and the company's EBITDA closes the table.
Overhead stays with the departments that carry it and appears as its own pool: as a share of revenue and per delivery FTE a month. An overhead department shows no margin and no utilisation.
From the cost of an hour to its margin
The internal hourly rates run as one chain, from the cost of an hour to its margin:
- Cost per capacity hour: what an hour of capacity costs, overhead included
- Utilisation: the share of the sellable time that is billed
- Break-even rate: what a billed hour must bring in to cover the cost
- Charged per hour: what a billed hour actually brought in
- Margin per billed hour: what the charged rate earns above the break-even rate
The rates tie back to each department's margin in the P&L, over any period chosen.
Summary, Analysis and Detail
Summary reads the latest month in the data. Six figures stand over the last twelve months, each with its change against the twelve before: revenue, contribution, margin, overhead as a share of revenue, utilisation and margin per billed hour. The scorecard follows for the month, the year to date and the last twelve months, then a margin trend for each delivery department.
Analysis and Detail read the month or year chosen in the picker. Detail holds the internal hourly rates, the P&L by department and people and hours by department.
In the group view, the rates cover every entity, in the group currency.
Terms
- Contribution
- A department's revenue less its own direct costs, before overhead.
- Overhead
- The net cost of the departments that sell no hours, such as management, finance and HR.
- Cost per Capacity Hour
- What an hour of the delivery team's capacity costs, with the overhead it carries.
- Break-Even Rate
- The hourly rate below which a billed hour loses money.
- Margin per Billed Hour
- What a billed hour earns above the break-even rate.
Data sources
- The monthly cost-centre P&L of each entity
- Monthly hours per cost centre
- Monthly headcount and FTE per cost centre
- The cost centres and their names, as set in the account mapping
- Monthly exchange rates, for entities that report in another currency
FAQ
What is a break-even hourly rate?
The rate a billed hour must bring in to cover the cost of the team and its overhead. CFO Foundry shows it for every department, beside what each hour actually brought in.
How is profitability per department measured?
As contribution: the department's revenue less its own personnel, external services and other operating costs, from the cost-centre P&L. Overhead is shown as its own pool.
Is overhead allocated to the departments?
The report shows overhead as its own pool, as a share of revenue and per delivery FTE. An allocation key is a choice about the business, and the contribution per department stands without one.
Get in touch
Describe your situation in a few lines. A reply typically follows within 1–2 business days.
To the Contact Form