Net working capital and the peg
How much cash the operations tie up at each month-end, and how far that sits from the level a sale would treat as normal.
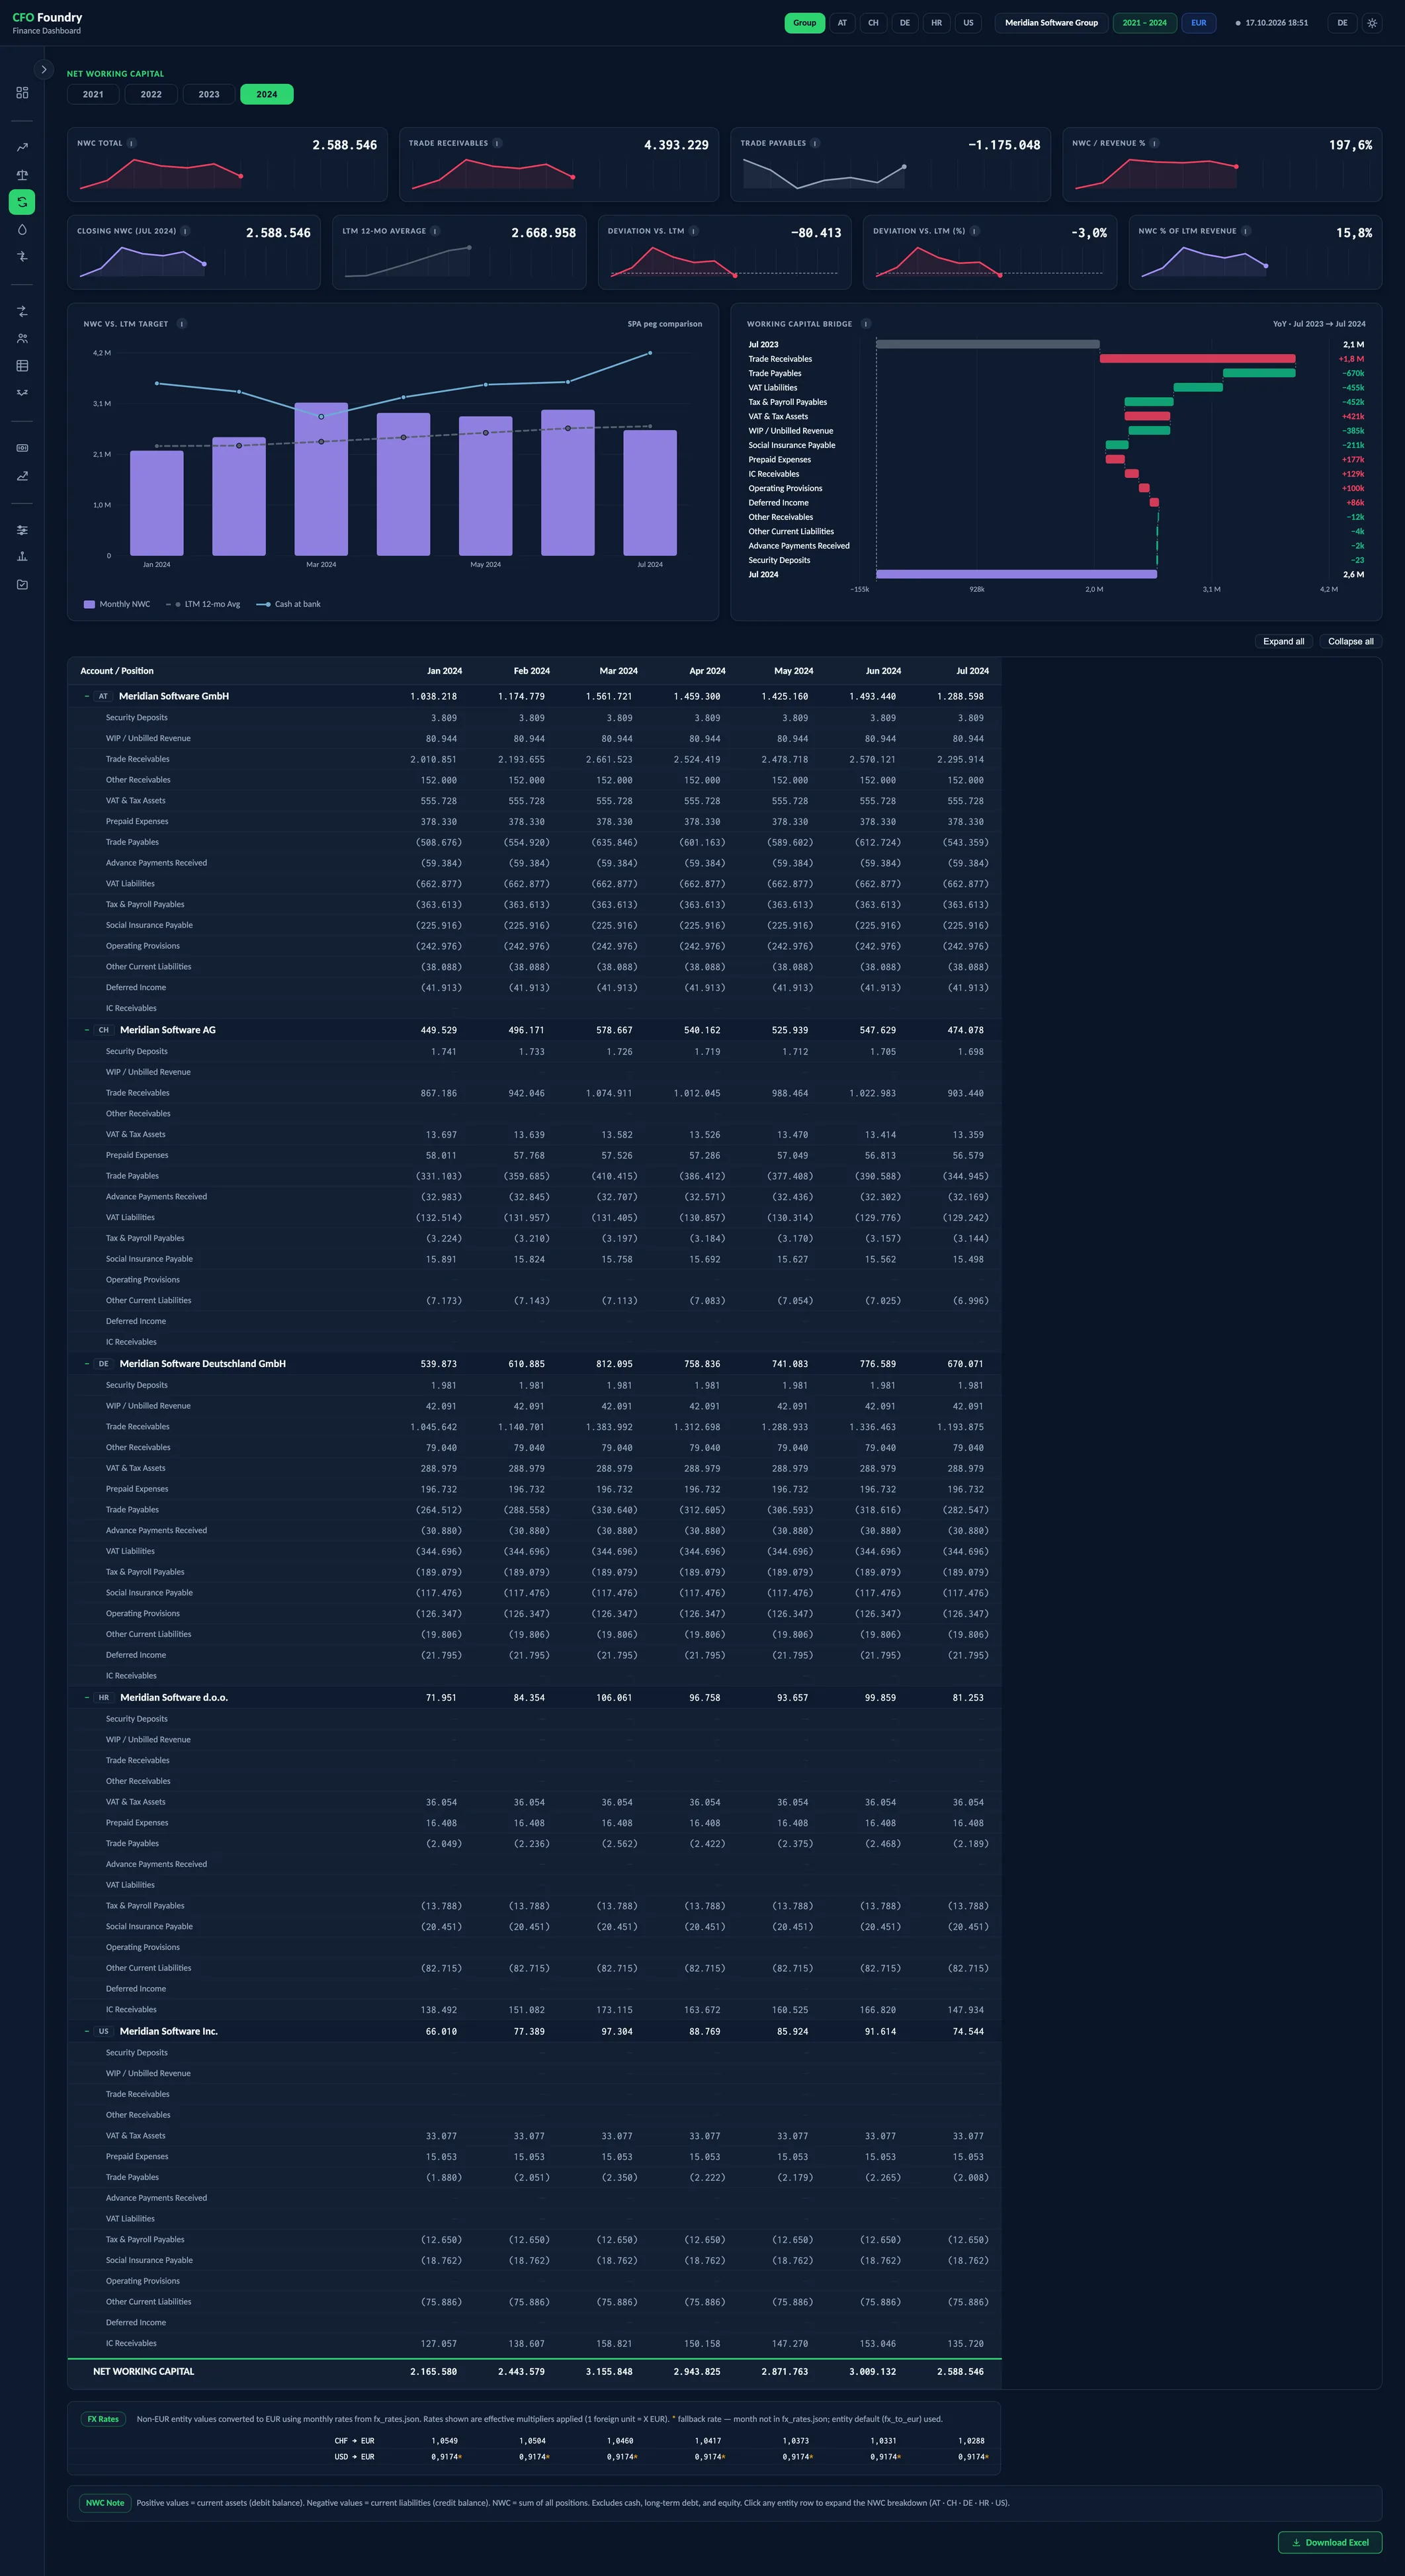
- 9 KPIs
- WORKING CAPITAL BRIDGE
Meridian is a fictional demo company. All figures are sample data.
Key questions
How much cash do the operations tie up?
Closing net working capital adds up every account the mapping treats as working capital, by category and by entity.
Is it above or below its normal level?
The closing balance stands against the average of the last twelve month-ends, as an amount and as a percentage.
Did it grow with the business?
Its share of the last twelve months' revenue rises when working capital grows faster than revenue.
In CFO Foundry
Down to the Account
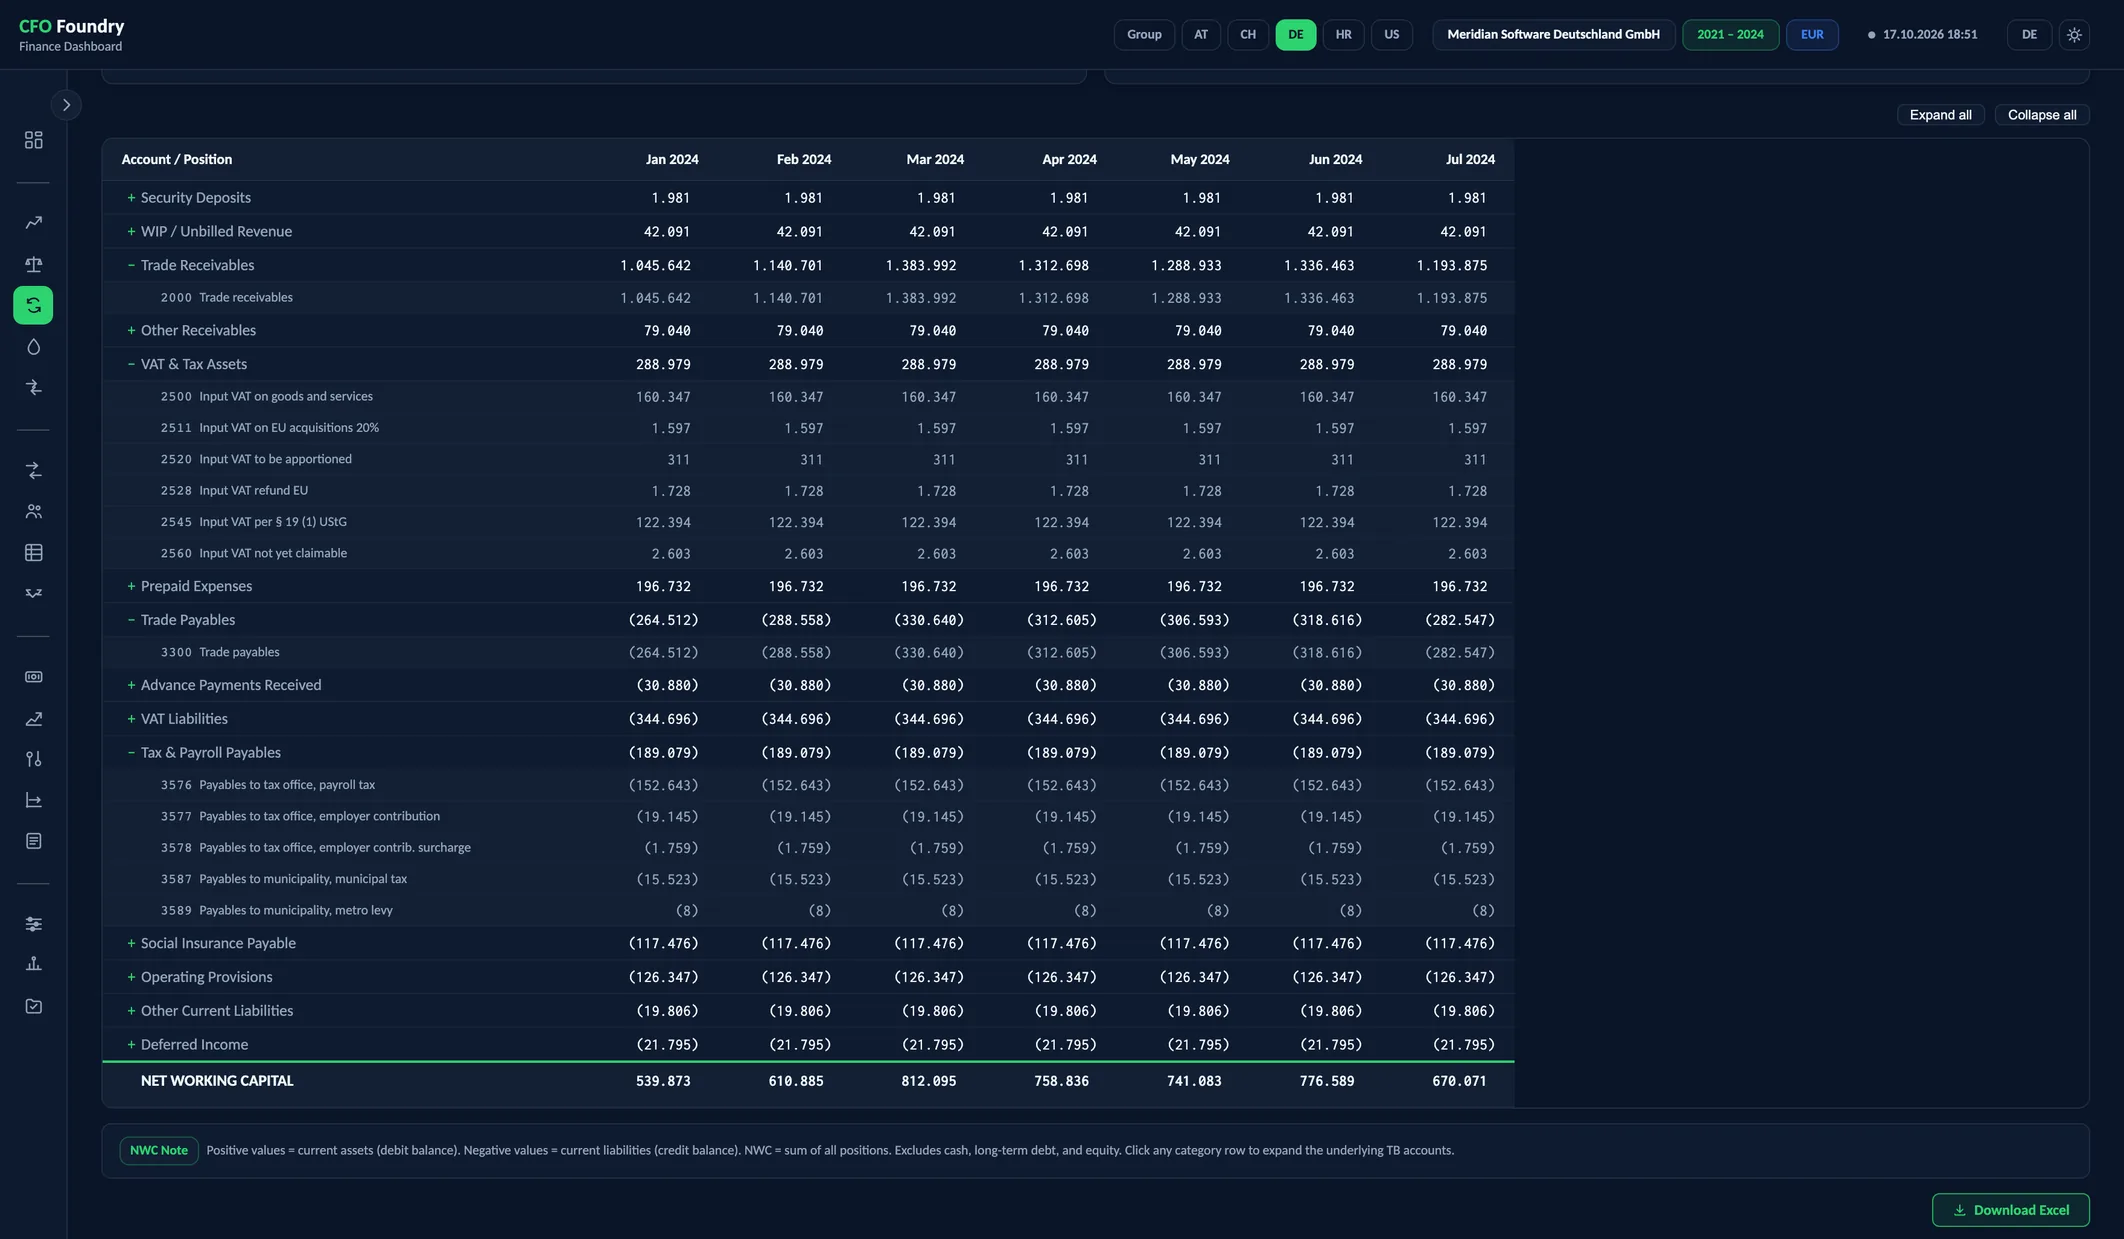
In an entity's view, each category row opens to the accounts behind it, with account number, name and the balance at every month-end. Expand all and Collapse all open or close the whole table at once.
The Excel Workbook
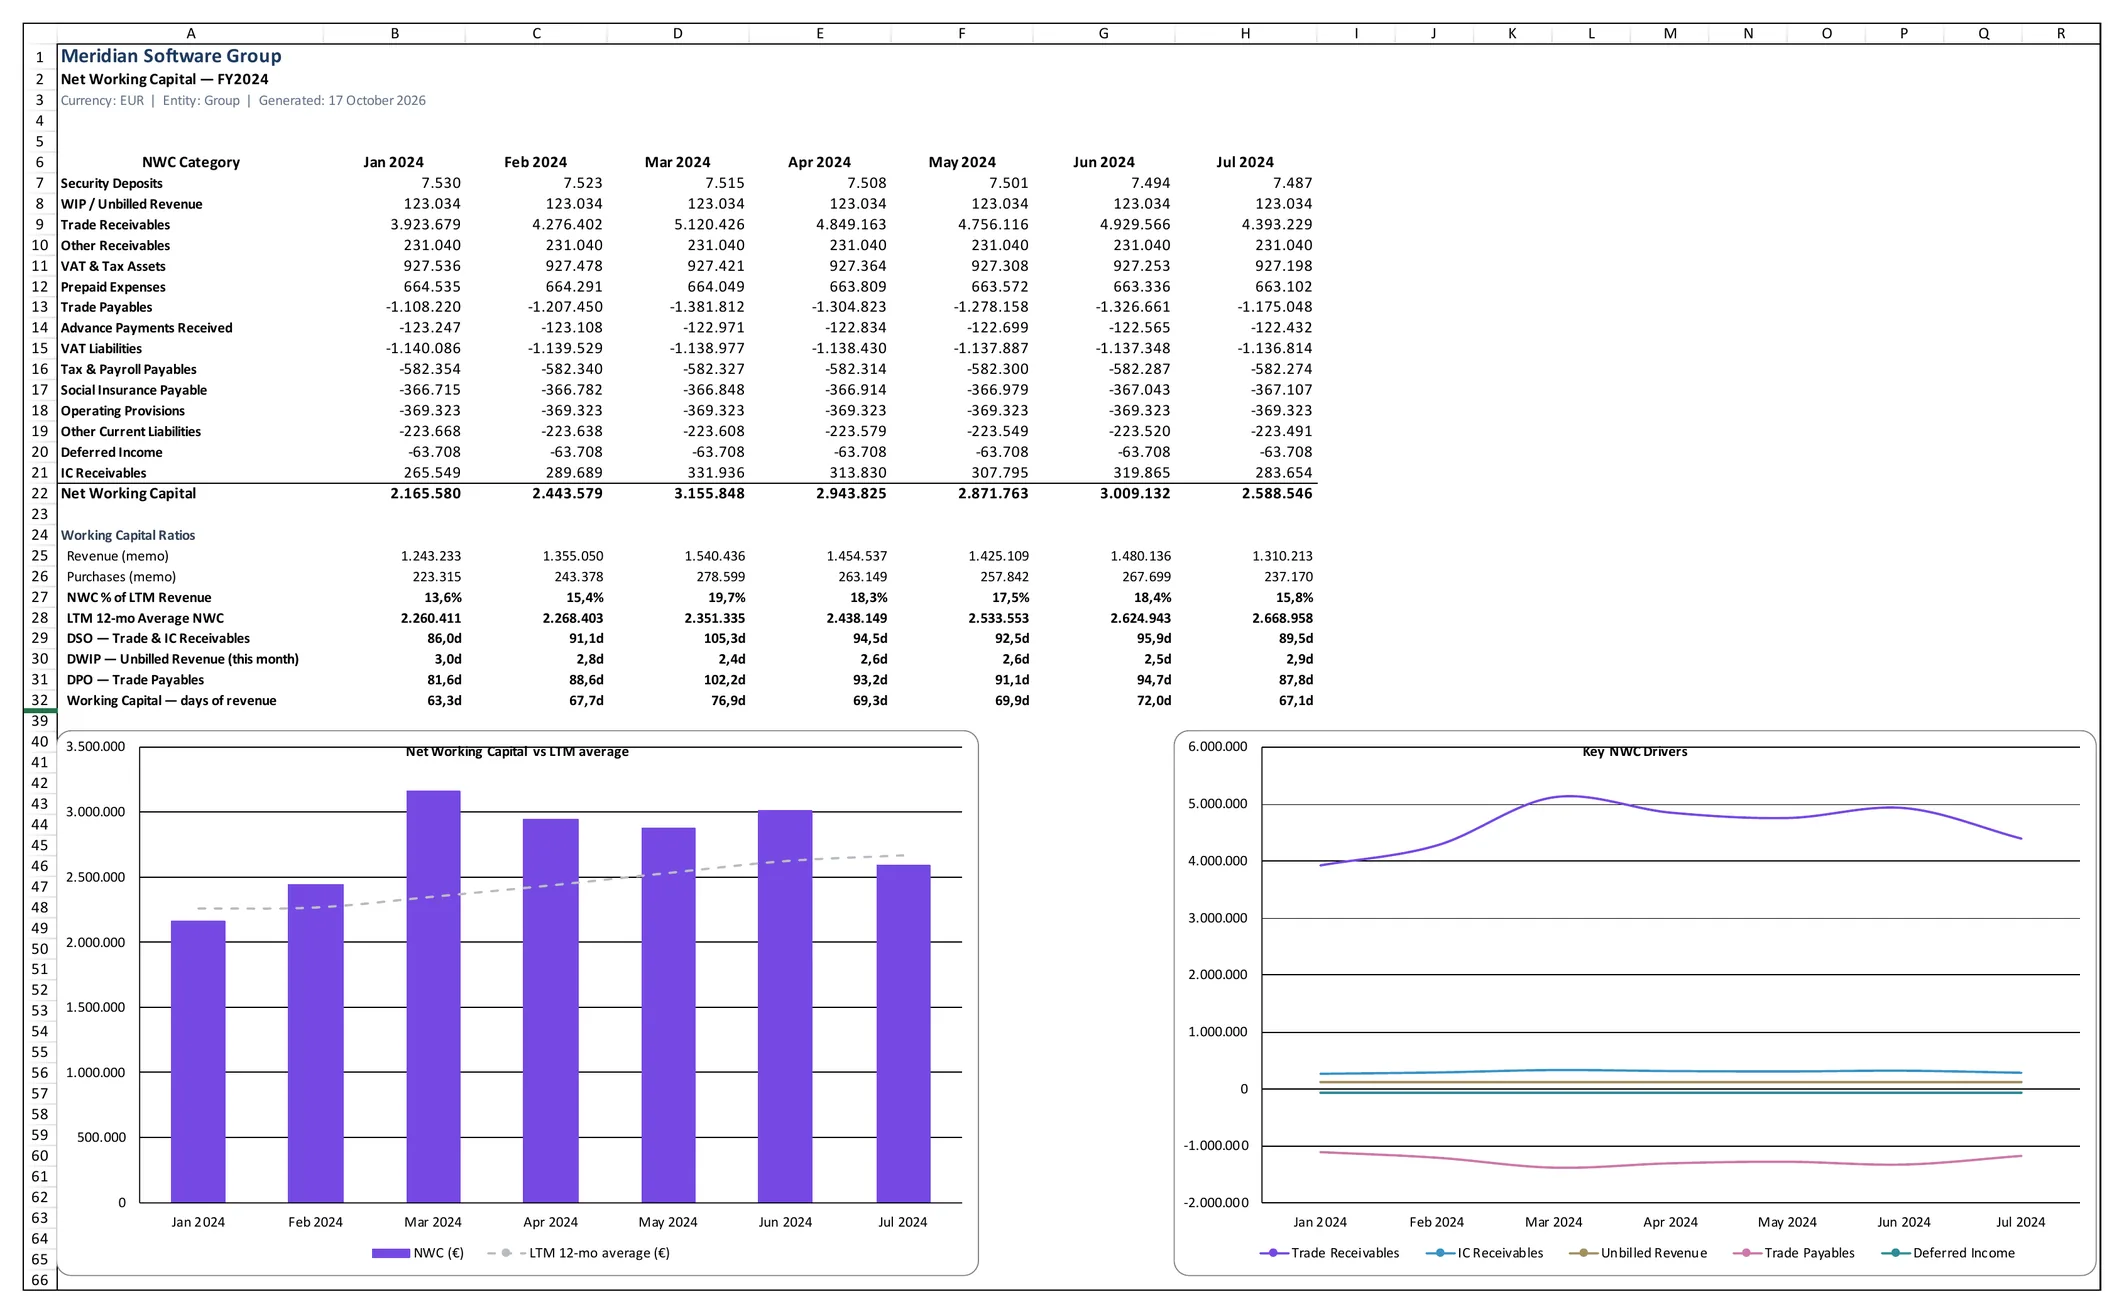
Download Excel exports the year as a workbook. Summary holds the categories month by month, the ratios and the charts. Detail lists every account, entity by entity in the group's workbook.
With a prior year in the data, two more sheets follow: the year-over-year bridge, written as formulas with a check row, and the comparison with the twelve-month average.
Set in the Mapping Wizard
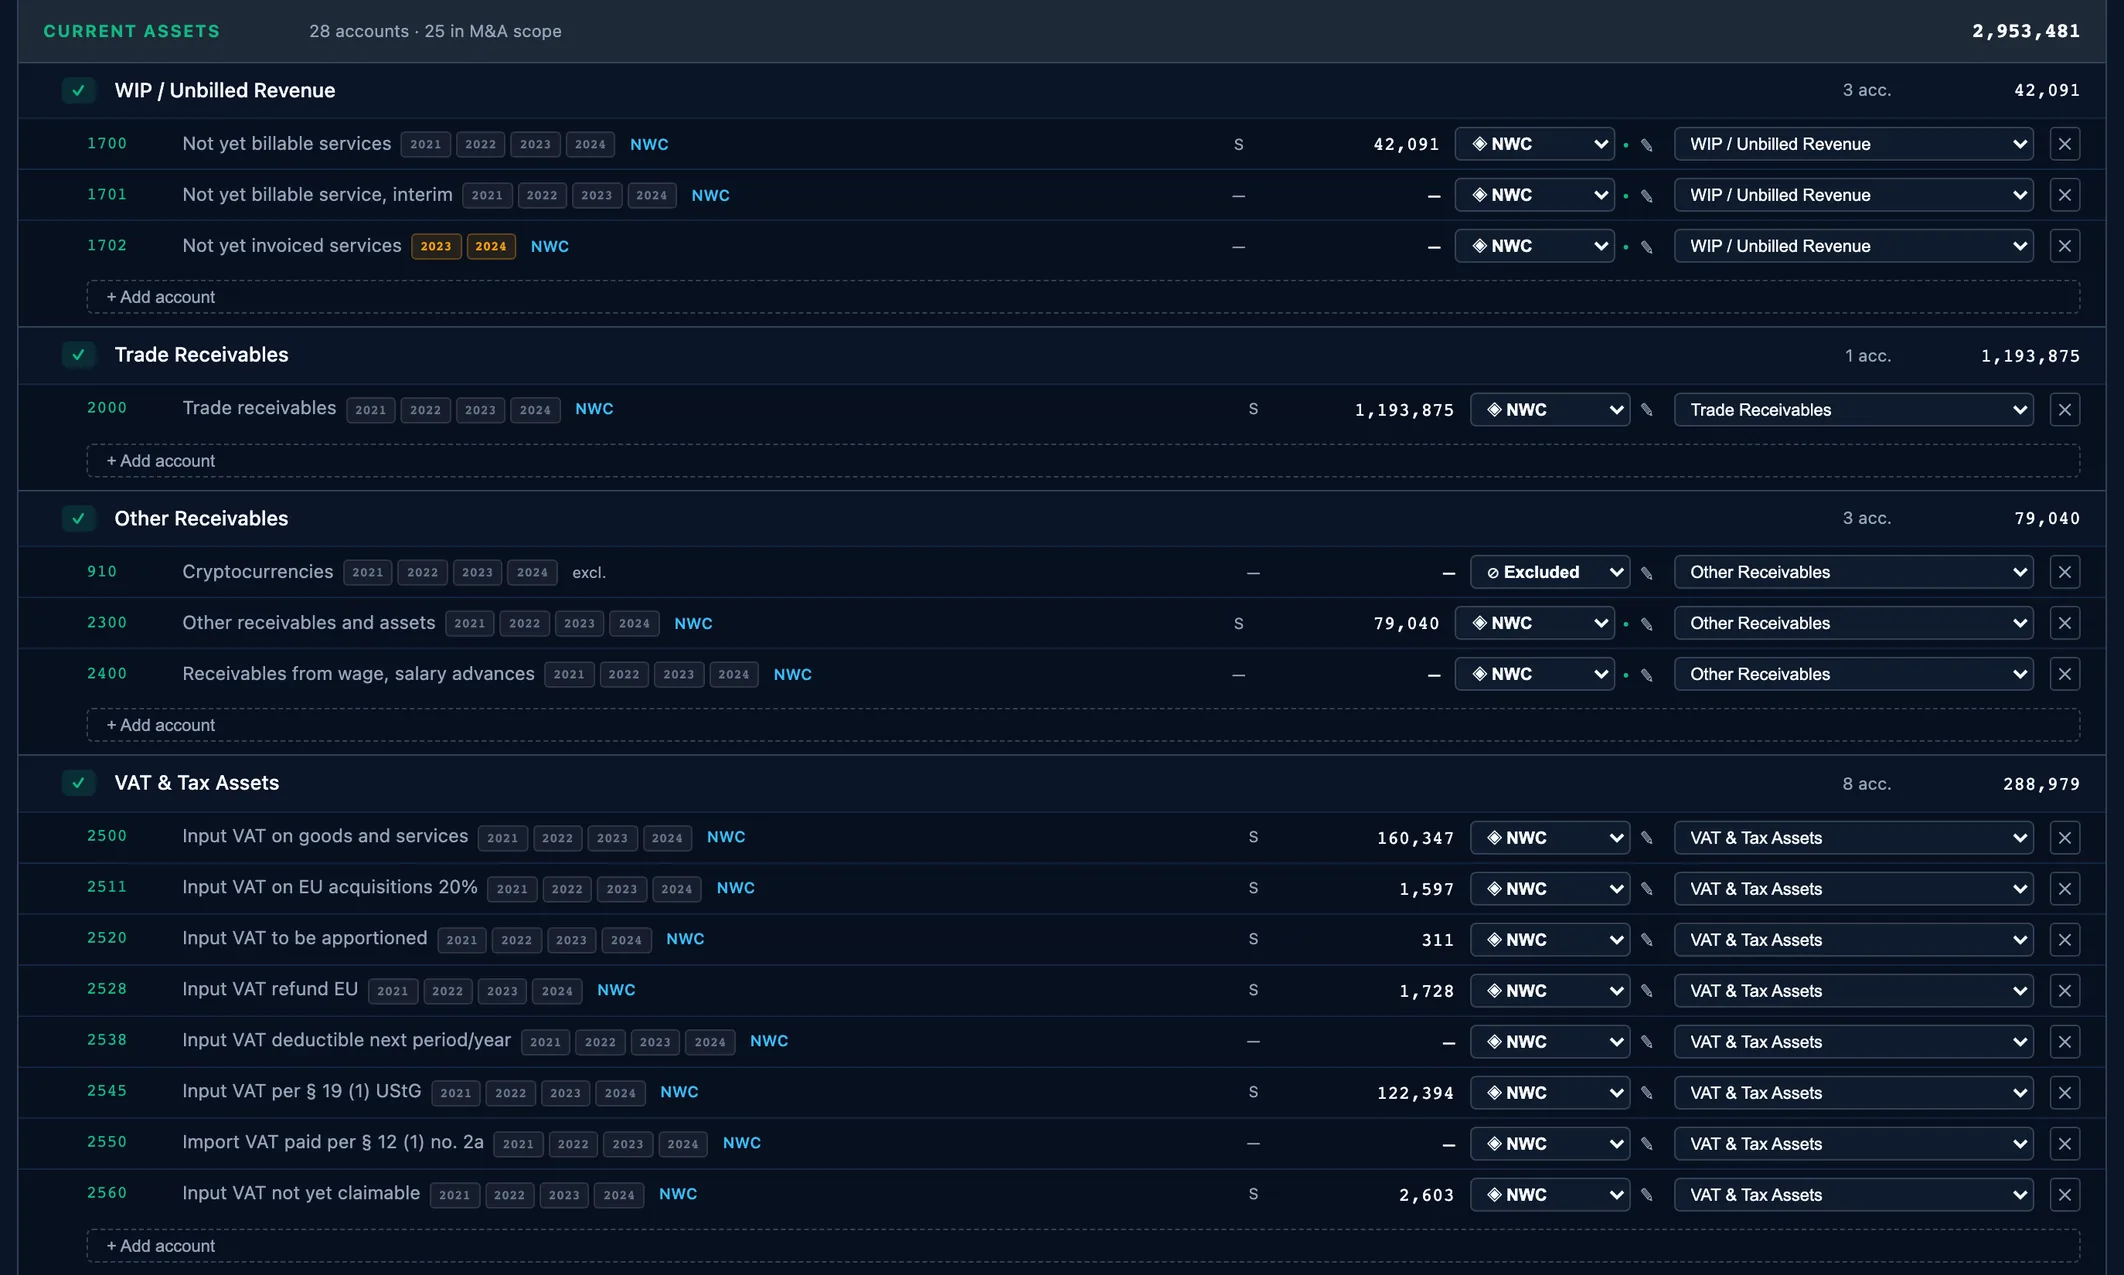
In the mapping wizard, each balance sheet account shows its treatment beside its category. Clear categories come with their usual treatment, and the others are set one by one.
The treatment set here decides what the report counts as working capital and as net debt, and with it the normal level and the bridge in the Transaction view.
Working capital against its normal level
Every working capital category opens to its GL accounts, per entity. Closing NWC stands against its twelve-month average, with cash at bank on the same chart. A year-over-year bridge shows which categories moved.
NWC
- NWC Total
- Trade Receivables
- Trade Payables
- NWC / Revenue %
- Closing NWC
- LTM 12-mo Average
- Deviation vs. LTM
- Deviation vs. LTM (%)
- NWC % of LTM Revenue
- NWC vs. LTM TARGET
- Working capital bridge
- Working capital bridge
How net working capital is defined
Every balance sheet account carries exactly one treatment in the account mapping: working capital, cash, debt or excluded. Net working capital is the sum of the accounts treated as working capital. Assets add to it and liabilities reduce it.
Cash and financial debt have a treatment of their own and count once, in net debt. The categories come from the CFO Foundry standard chart. Typical ones in a services company:
- Trade receivables, work in progress and unbilled revenue
- Prepaid expenses, VAT and other tax assets, other receivables
- Trade payables, tax and payroll liabilities
- Operating provisions, deferred income and advance payments received
The normal level and seasonality
The report takes the average of the last twelve month-end balances as the normal level. Twelve months hold each calendar month once, so a year-end billing peak or a quiet summer is already inside the average.
With fewer than twelve months of history the report shows no average. The bridge from enterprise value to equity value in the Transaction view starts from the same twelve-month average, and its own setting can change the window.
DSO, DPO and trade working capital
Days sales outstanding and days payables outstanding appear on the dashboard and in the AR & AP view, measured once and shown the same in both.
Both are measured on the company's own recent months, so a growing or seasonal business is read at its current pace.
Beside them, the dashboard shows trade working capital in days of revenue.
Working capital in a sale
A company is usually sold cash-free and debt-free with a normal level of working capital. Seller and buyer agree that level as the peg, and the purchase price moves by the difference between the balance at closing and the peg.
A balance above the peg adds to the price, and one below it reduces the price. A peg drawn from the company's own month-end history, account by account, is a figure the seller can show and defend.
Terms
- Net Working Capital (NWC)
- The accounts the mapping treats as working capital, assets less liabilities: the cash the operations tie up.
- Working Capital Peg
- The normal level of net working capital agreed in a sale, against which the balance at closing is settled.
- DSO
- Days sales outstanding: how many days of revenue the open receivables represent.
- DPO
- Days payables outstanding: how many days of purchases the open payables represent.
- Trade Working Capital
- Receivables less payables, the same balances DSO and DPO measure, expressed in days of revenue.
- LTM
- Last twelve months, counted back from the month shown.
Data sources
- The monthly trial balance of each entity
- The account mapping: each account's category and its treatment
- Revenue and purchases from the same trial balances, for the share of revenue and the day counts
- Monthly exchange rates, for entities that report in another currency
FAQ
How is the working capital peg calculated?
Commonly as the average of the month-end balances over the last twelve months, which takes in a full seasonal cycle. CFO Foundry calculates that average every month from the trial balance, so the level is known long before a sale.
Which accounts belong to net working capital?
Every account the mapping treats as working capital: receivables, work in progress, prepaid expenses, tax assets, payables, tax and payroll liabilities, operating provisions and deferred income. Cash and financial debt are treated separately.
What do DSO and DPO measure?
DSO is how many days of revenue the open receivables represent, DPO how many days of purchases the open payables represent. CFO Foundry measures both on the company's own recent months, so a growing or seasonal business is read at its current pace.
Why does working capital matter when selling a company?
The purchase price is usually adjusted by the difference between working capital at closing and the agreed peg, so every amount above or below it changes what the seller receives.
Get in touch
Describe your situation in a few lines. A reply typically follows within 1–2 business days.
To the Contact Form