From adjusted EBITDA to equity value
What the company is worth to its owners at a chosen month, and which open positions could change that figure.
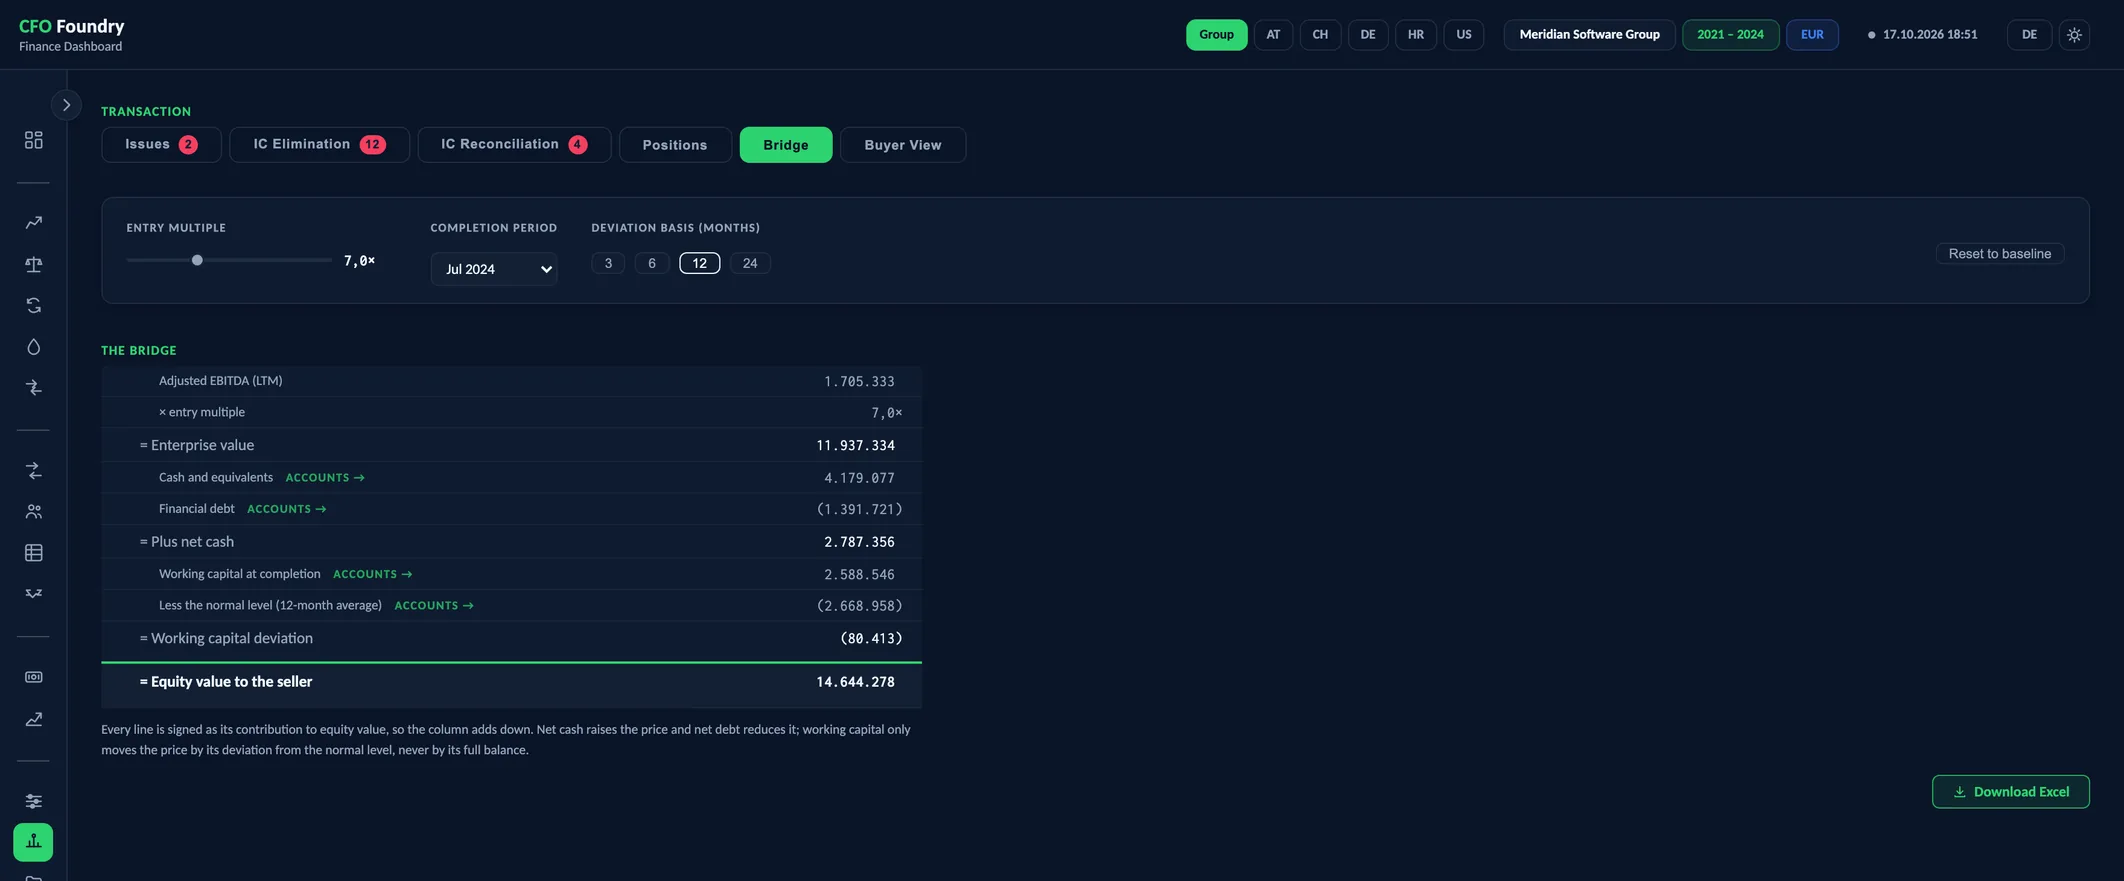
- THE BRIDGE
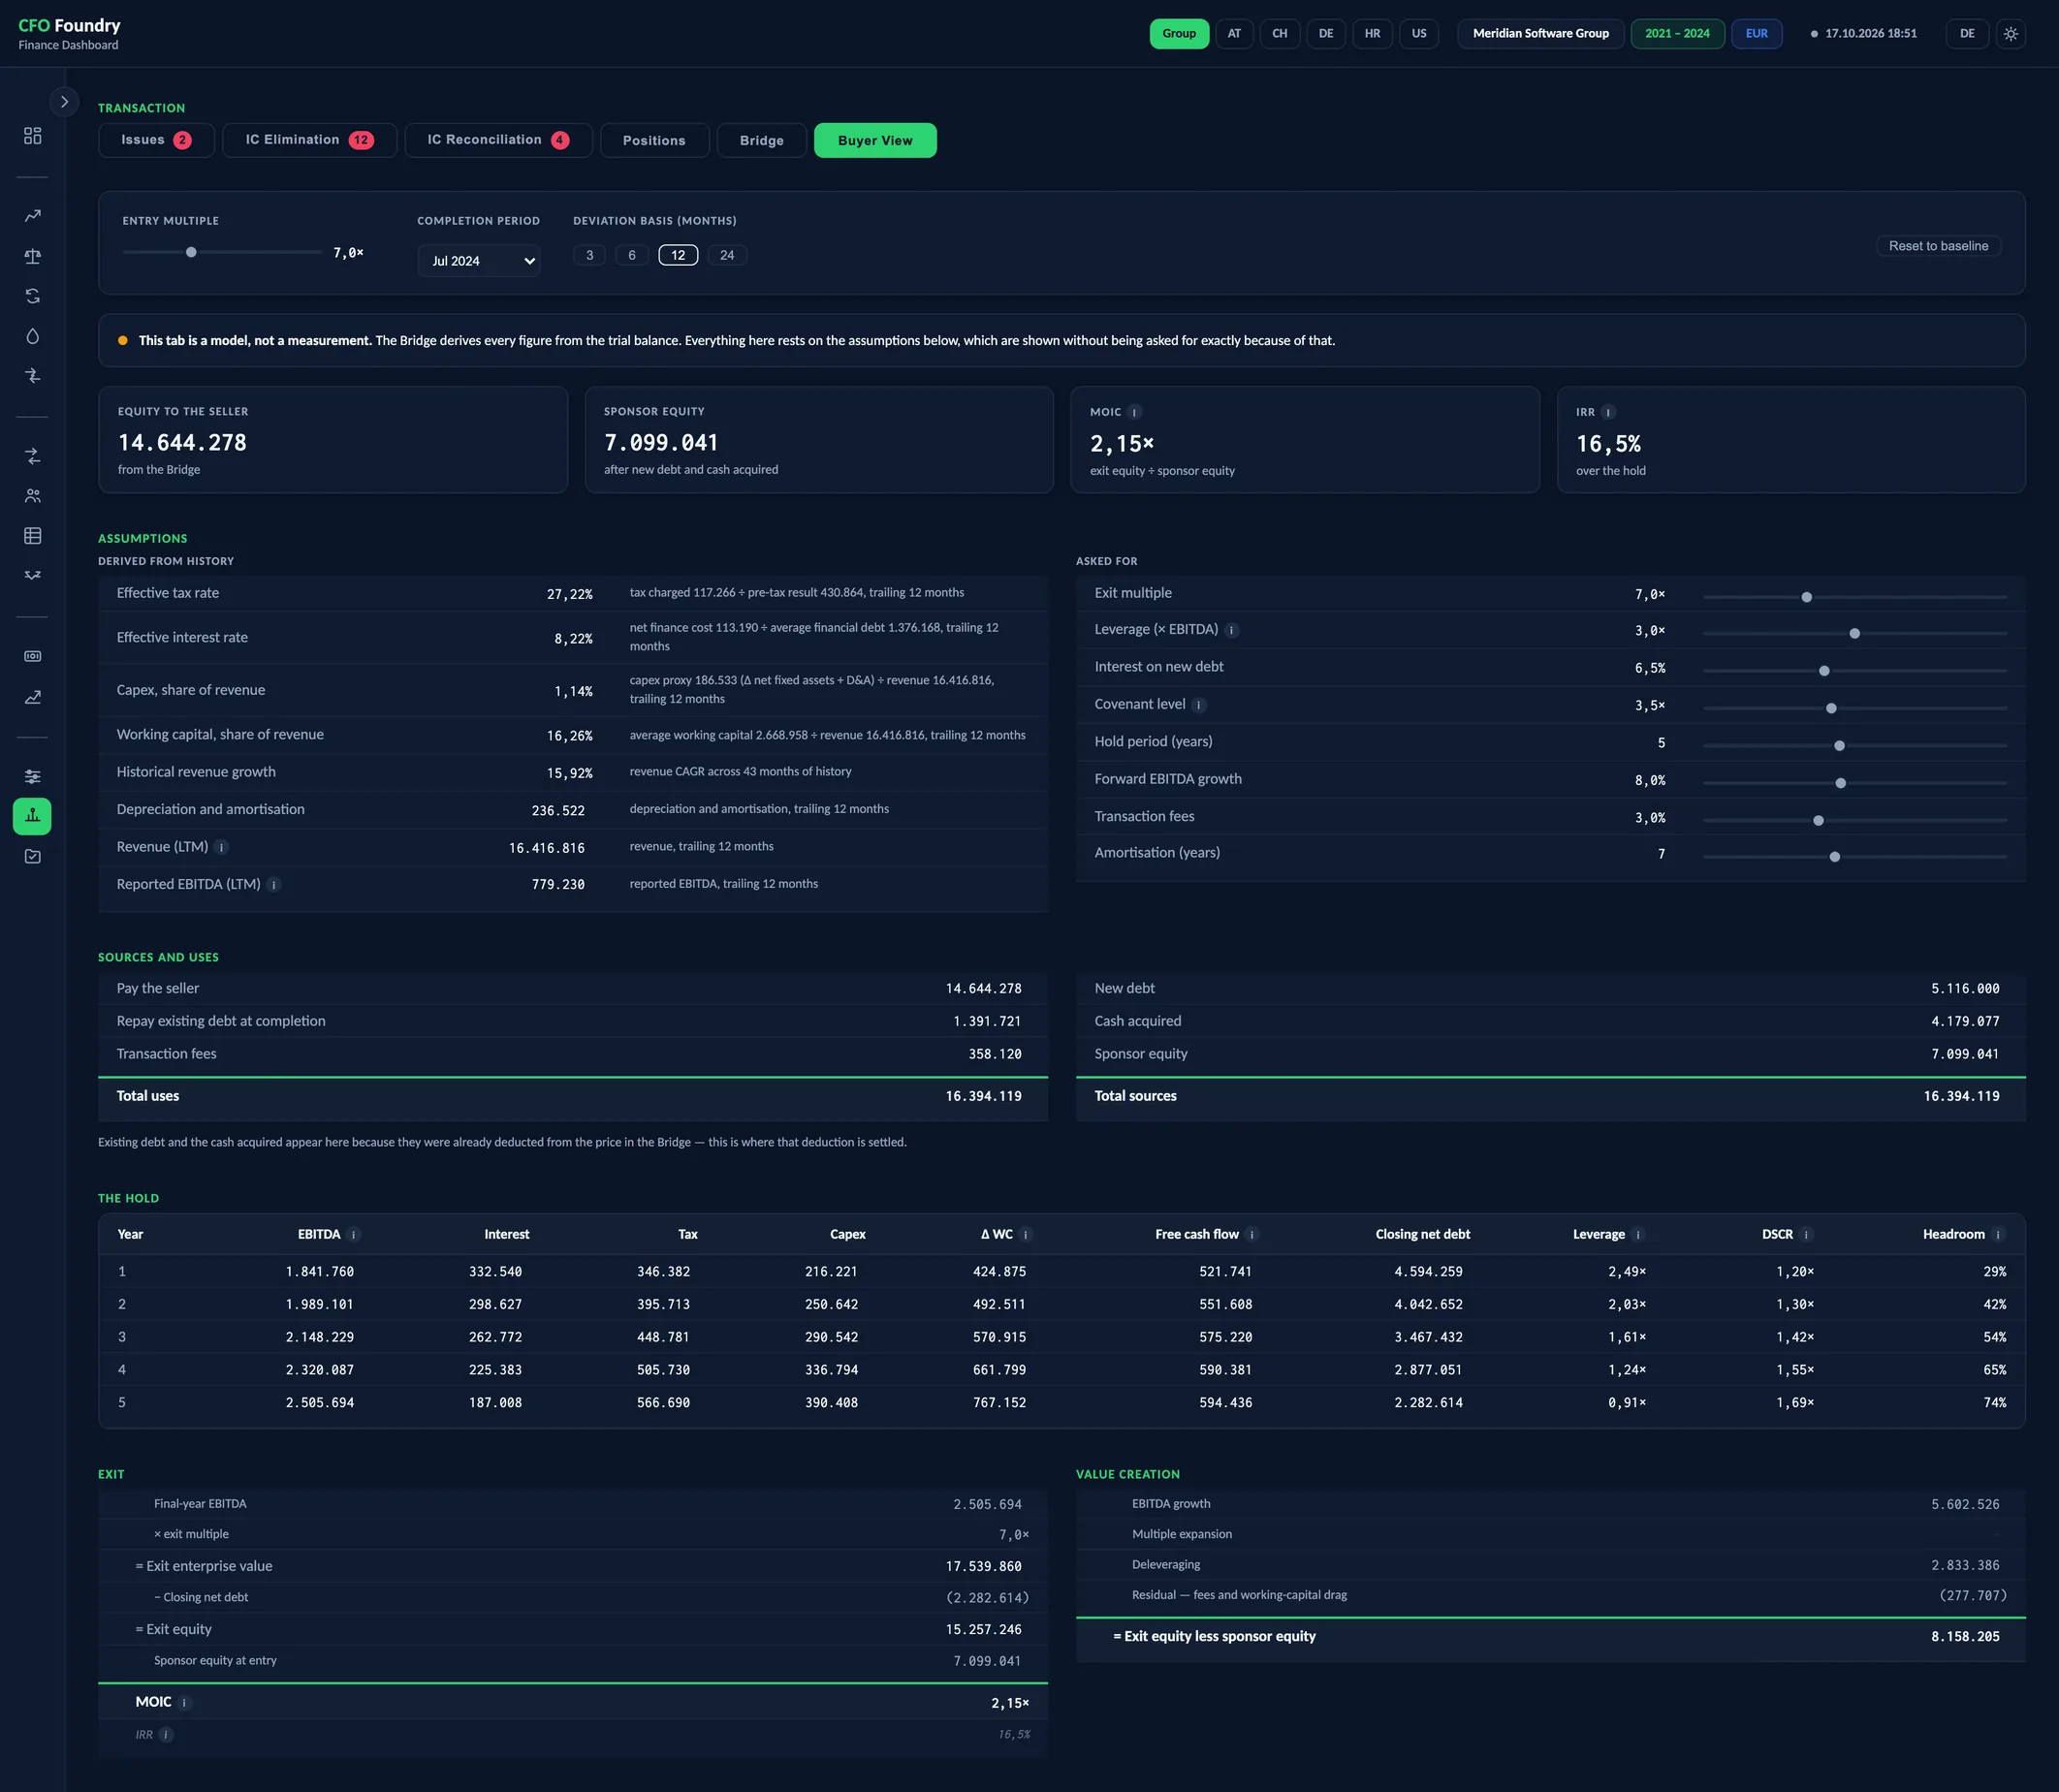
- 4 KPIs
- ASSUMPTIONS
- SOURCES AND USES
- THE HOLD
- EXIT
- VALUE CREATION
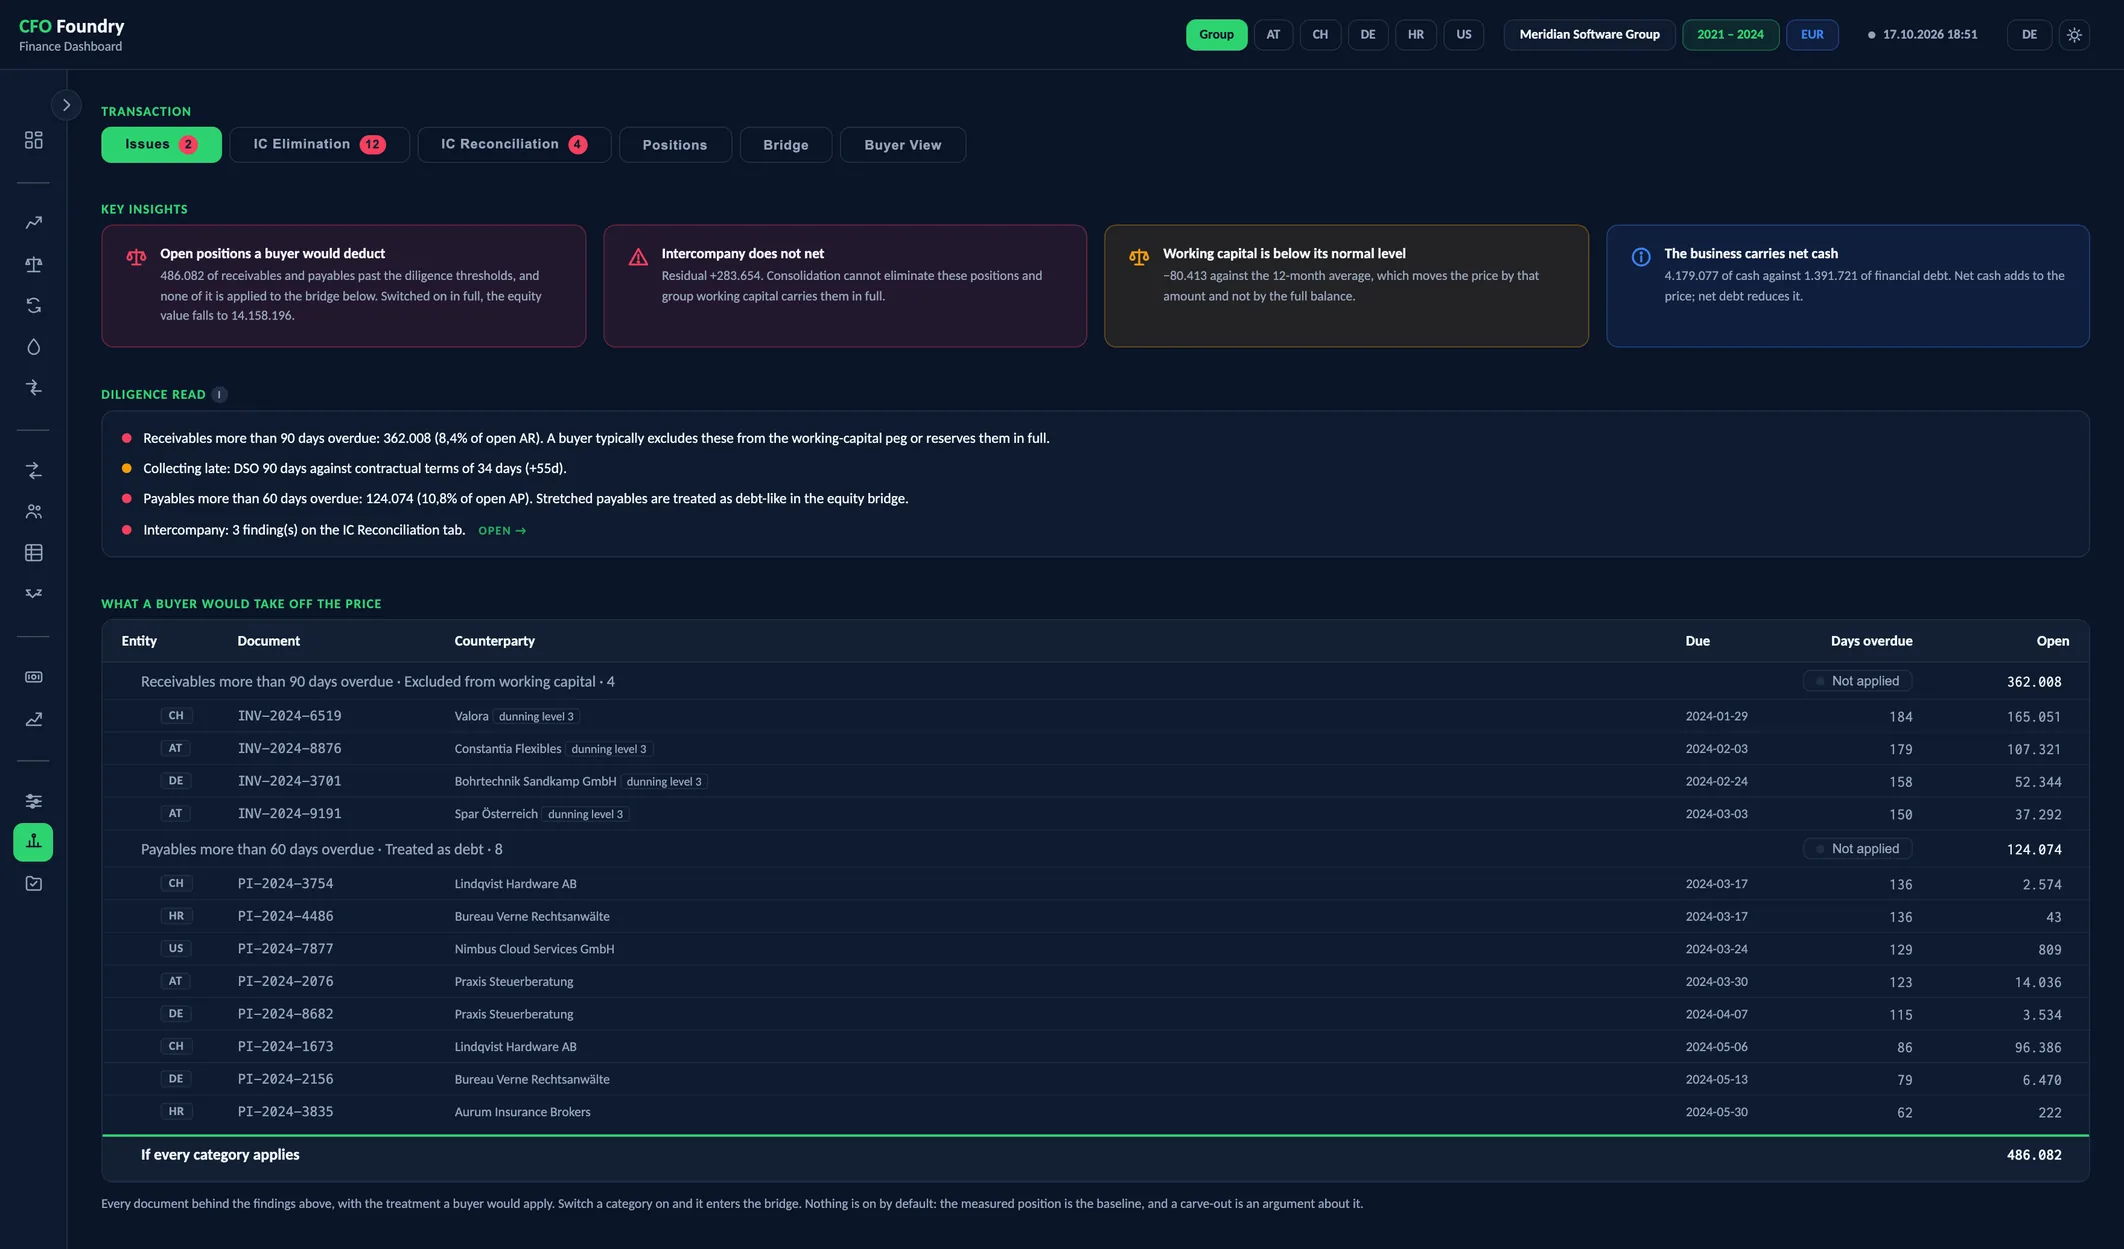
- WHAT A BUYER WOULD TAKE OFF THE PRICE
Meridian is a fictional demo company. All figures are sample data.
Key questions
What is the equity worth at a given multiple?
The bridge multiplies adjusted EBITDA of the last twelve months by the entry multiple, adds net cash and the working capital deviation, and arrives at equity value to the seller.
What could come off the price?
Issues lists the open findings with their amounts: overdue and disputed receivables, payables paid late and intercompany balances that do not agree.
How would a financial buyer model the deal?
Buyer View models the financing, the hold and the exit, with leverage, covenant headroom, MOIC and IRR.
From adjusted EBITDA to equity value
Six tabs, from the open issues to the buyer's model. The bridge runs from adjusted EBITDA through the entry multiple, net cash and working capital to equity value, each line signed by what it adds to or takes off the price. Working capital moves the price by its deviation from normal. Carve-outs show what a disputed or stale position would cost.
Transaction
- Issues
- IC Elimination
- IC Reconciliation
- Positions
- Bridge
- Buyer View
- Equity to the seller
- Sponsor equity
- MOIC
- IRR
- What a buyer would take off the price
- Last 12 months
- Accounts
- Loans
- What does not net
- Ledgers — who owes whom
- Working capital — accounts
- Deviation from the normal level
- Cash — accounts
- Debt — accounts
- The bridge
- Assumptions
- Sources and uses
- The hold
- Exit
- Value creation
- Entry multiple
- Completion period
- Deviation basis (months)
The bridge, line by line
The bridge is struck at one completion month and reads downwards. Every line carries the sign of its contribution to equity value, so the column adds up.
- Adjusted EBITDA of the last twelve months, times the entry multiple, gives enterprise value
- Cash and cash equivalents less financial debt give net cash, which adds to the price; net debt reduces it
- Working capital at completion less its normal level gives the working capital deviation
- The sum is equity value to the seller
Three settings sit above it: the entry multiple, the completion month and the period over which the normal level is averaged, set by the user. The figures follow as they move. With less history than that period needs, the report shows no deviation and no equity value.
Cash, debt and working capital from the mapping
Every balance sheet account carries exactly one treatment in the account mapping: working capital, cash, debt or excluded. Each balance therefore counts once, either in working capital or in net debt.
Positions lists the accounts behind each line, grouped as on the working capital page, and the deviation from the normal level. Working capital is read from the working capital view and is the same figure. In the group report, intercompany balances are eliminated before net debt, and any part that does not net is shown as a figure of its own.
Issues and intercompany
The view opens on Issues. From the receivables and payables ledgers it takes three kinds of position a buyer's diligence would question: stale receivables, disputed receivables and stretched payables. Each category carries its documents, its total and a switch.
Every switch starts off, so the bridge begins from the trial balance. A receivable switched on leaves working capital, and a stretched payable joins net debt.
The group report adds two tabs. IC Elimination checks month by month that what one entity bills within the group another books as a cost. IC Reconciliation checks that intercompany balances agree between the entities, and names the accounts to open and the booking that closes a difference. Corrections are made in the books and appear at the next build.
The Buyer View
Buyer View models the deal the way a financial buyer would: sources and uses, then the hold year by year with EBITDA, interest, tax, capex, the change in working capital, free cash flow, net debt, leverage, debt service cover and covenant headroom. Exit and value creation follow, split into EBITDA growth, multiple expansion and deleveraging.
Tax rate, interest rate, capex and working capital intensity are measured from the company's own history, each shown with the figures it rests on. Leverage, debt rate, covenant, hold period, growth and the exit multiple are settings.
Download Excel writes the bridge as one workbook across all years, with the baseline as measured. Its Issues sheet goes into the workbook only when the company decides to disclose it.
Terms
- Enterprise Value
- The value of the business before cash and debt: here, adjusted EBITDA of the last twelve months times the multiple.
- Equity Value
- What the owners receive: enterprise value plus net cash, adjusted for the working capital deviation.
- Net Debt
- Financial debt less cash and cash equivalents. A negative figure is net cash.
- Working Capital Deviation
- Working capital at completion less its normal level, the average of the trailing months.
- MOIC
- Multiple on invested capital: the sponsor's equity at exit divided by the equity it put in.
- IRR
- Internal rate of return: the annual return that MOIC implies over the hold period.
Data sources
- The monthly trial balance of each entity
- The account mapping: each balance sheet account's treatment as working capital, cash, debt or excluded
- The adjustments, for adjusted EBITDA
- The receivables and payables ledgers, for the issues
- Monthly exchange rates, for entities that report in another currency
FAQ
How do you get from enterprise value to equity value?
Add net cash or subtract net debt, then add or subtract the difference between working capital at completion and its normal level. Debt-like items found in diligence come off as well.
What does cash-free, debt-free mean?
The price is agreed for the business with a normal level of working capital. Cash the company holds is added to it and financial debt is deducted, so the seller receives the value net of debt.
How is net debt calculated?
Financial debt less cash and cash equivalents, from the balance sheet accounts treated as debt and as cash. A negative result is net cash and raises the price.
What are debt-like items?
Obligations that act like debt without being a loan, such as supplier payables stretched past their terms. CFO Foundry lists stretched payables from the ledgers and, when switched on, adds them to net debt.
Get in touch
Describe your situation in a few lines. A reply typically follows within 1–2 business days.
To the Contact Form