Clients, retention and pipeline
Who the revenue comes from, how much of it stays from one year to the next, and what is already in the pipeline.
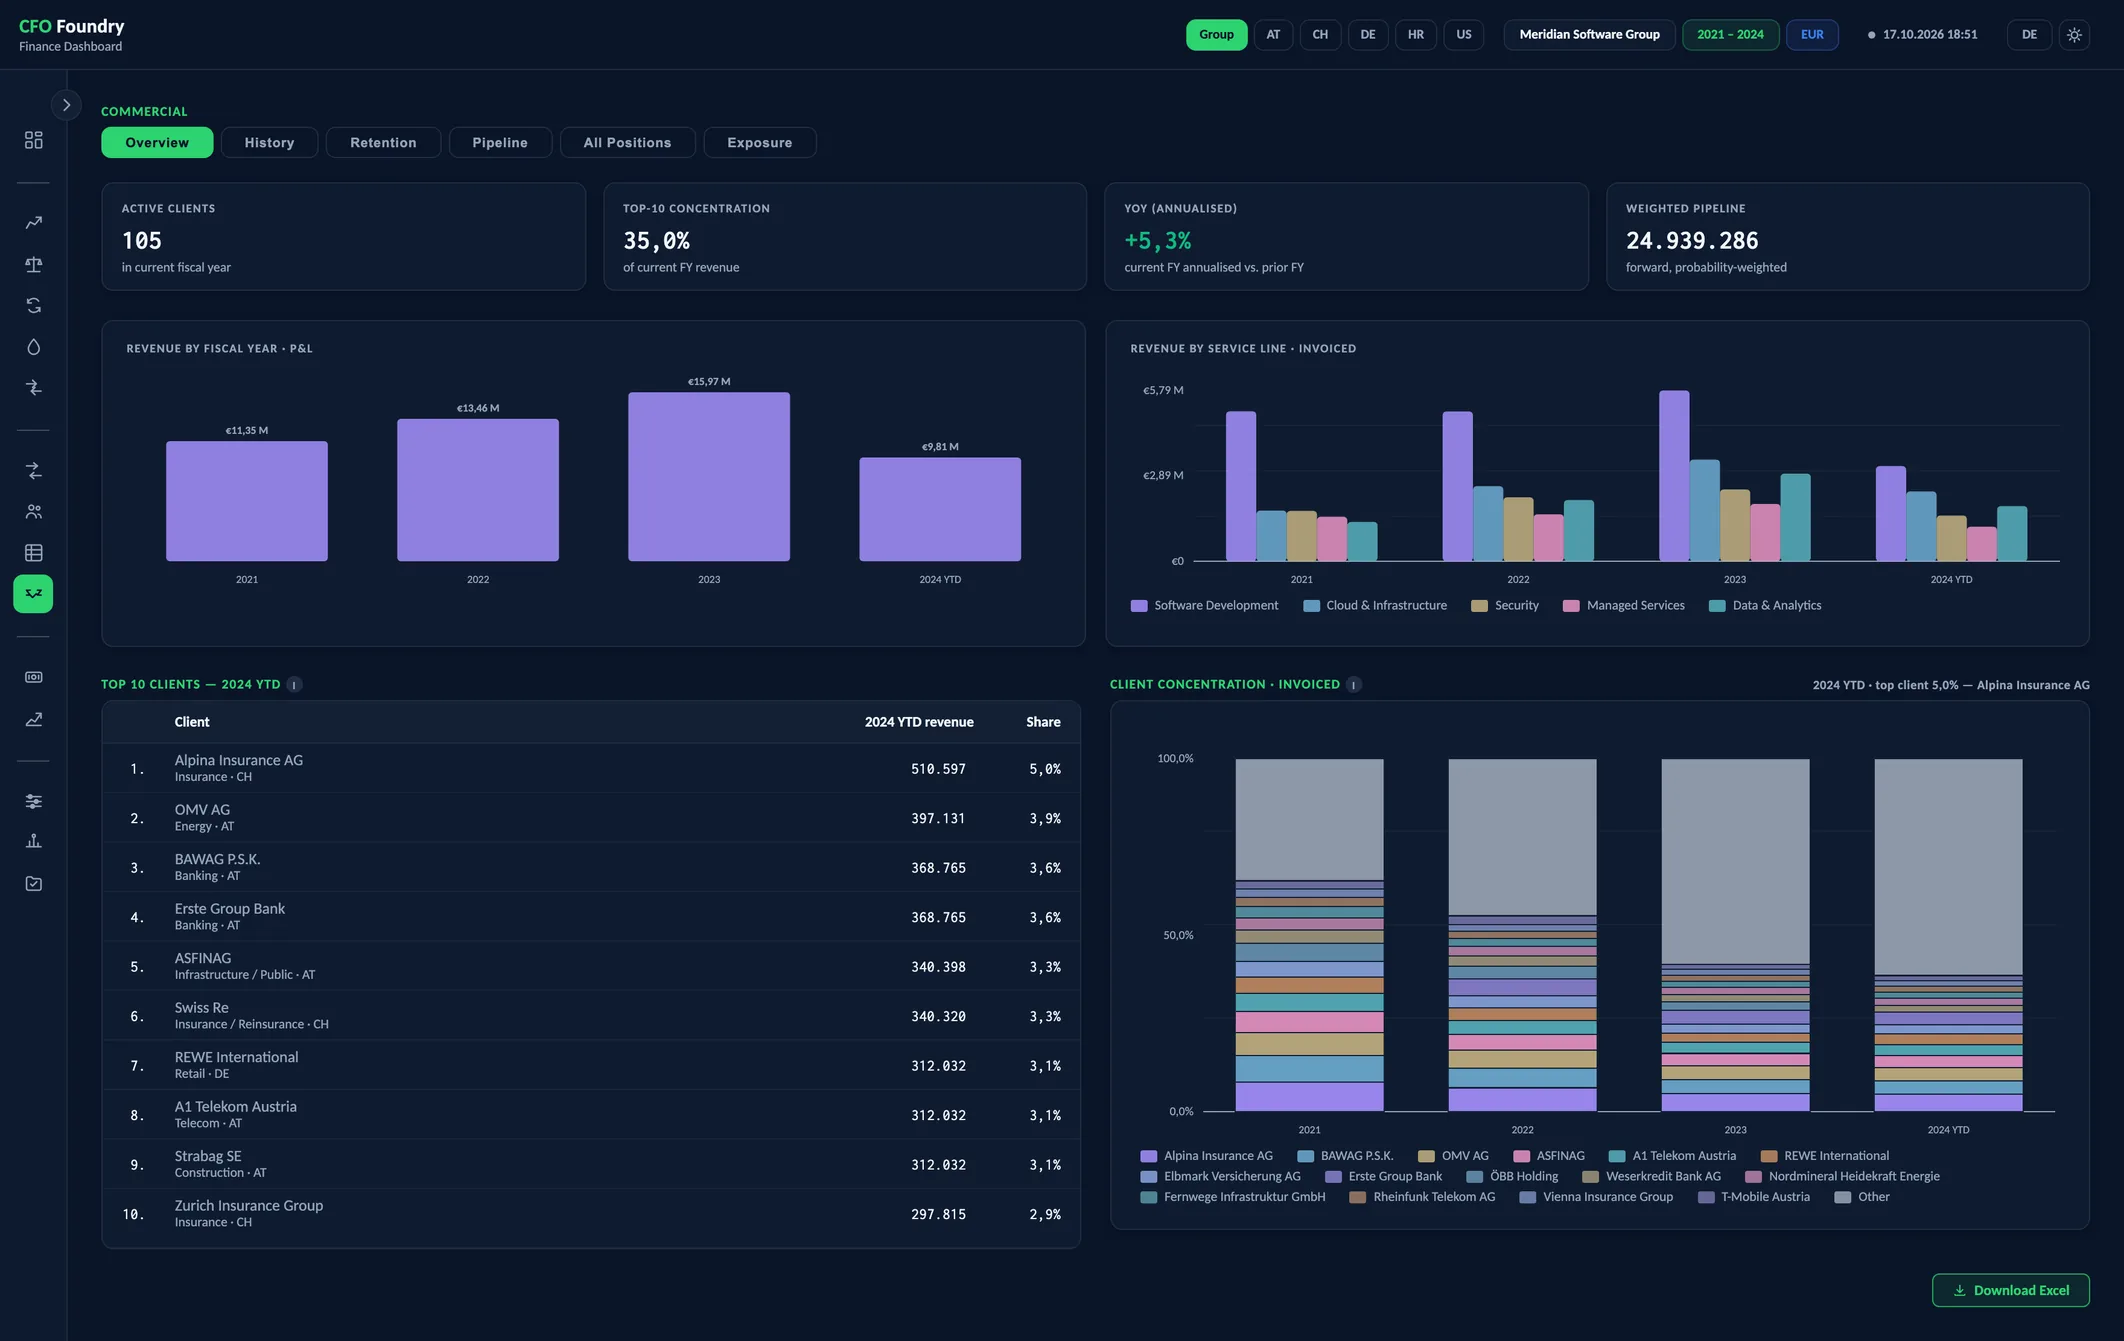
- 4 KPIs
- TOP 10 CLIENTS
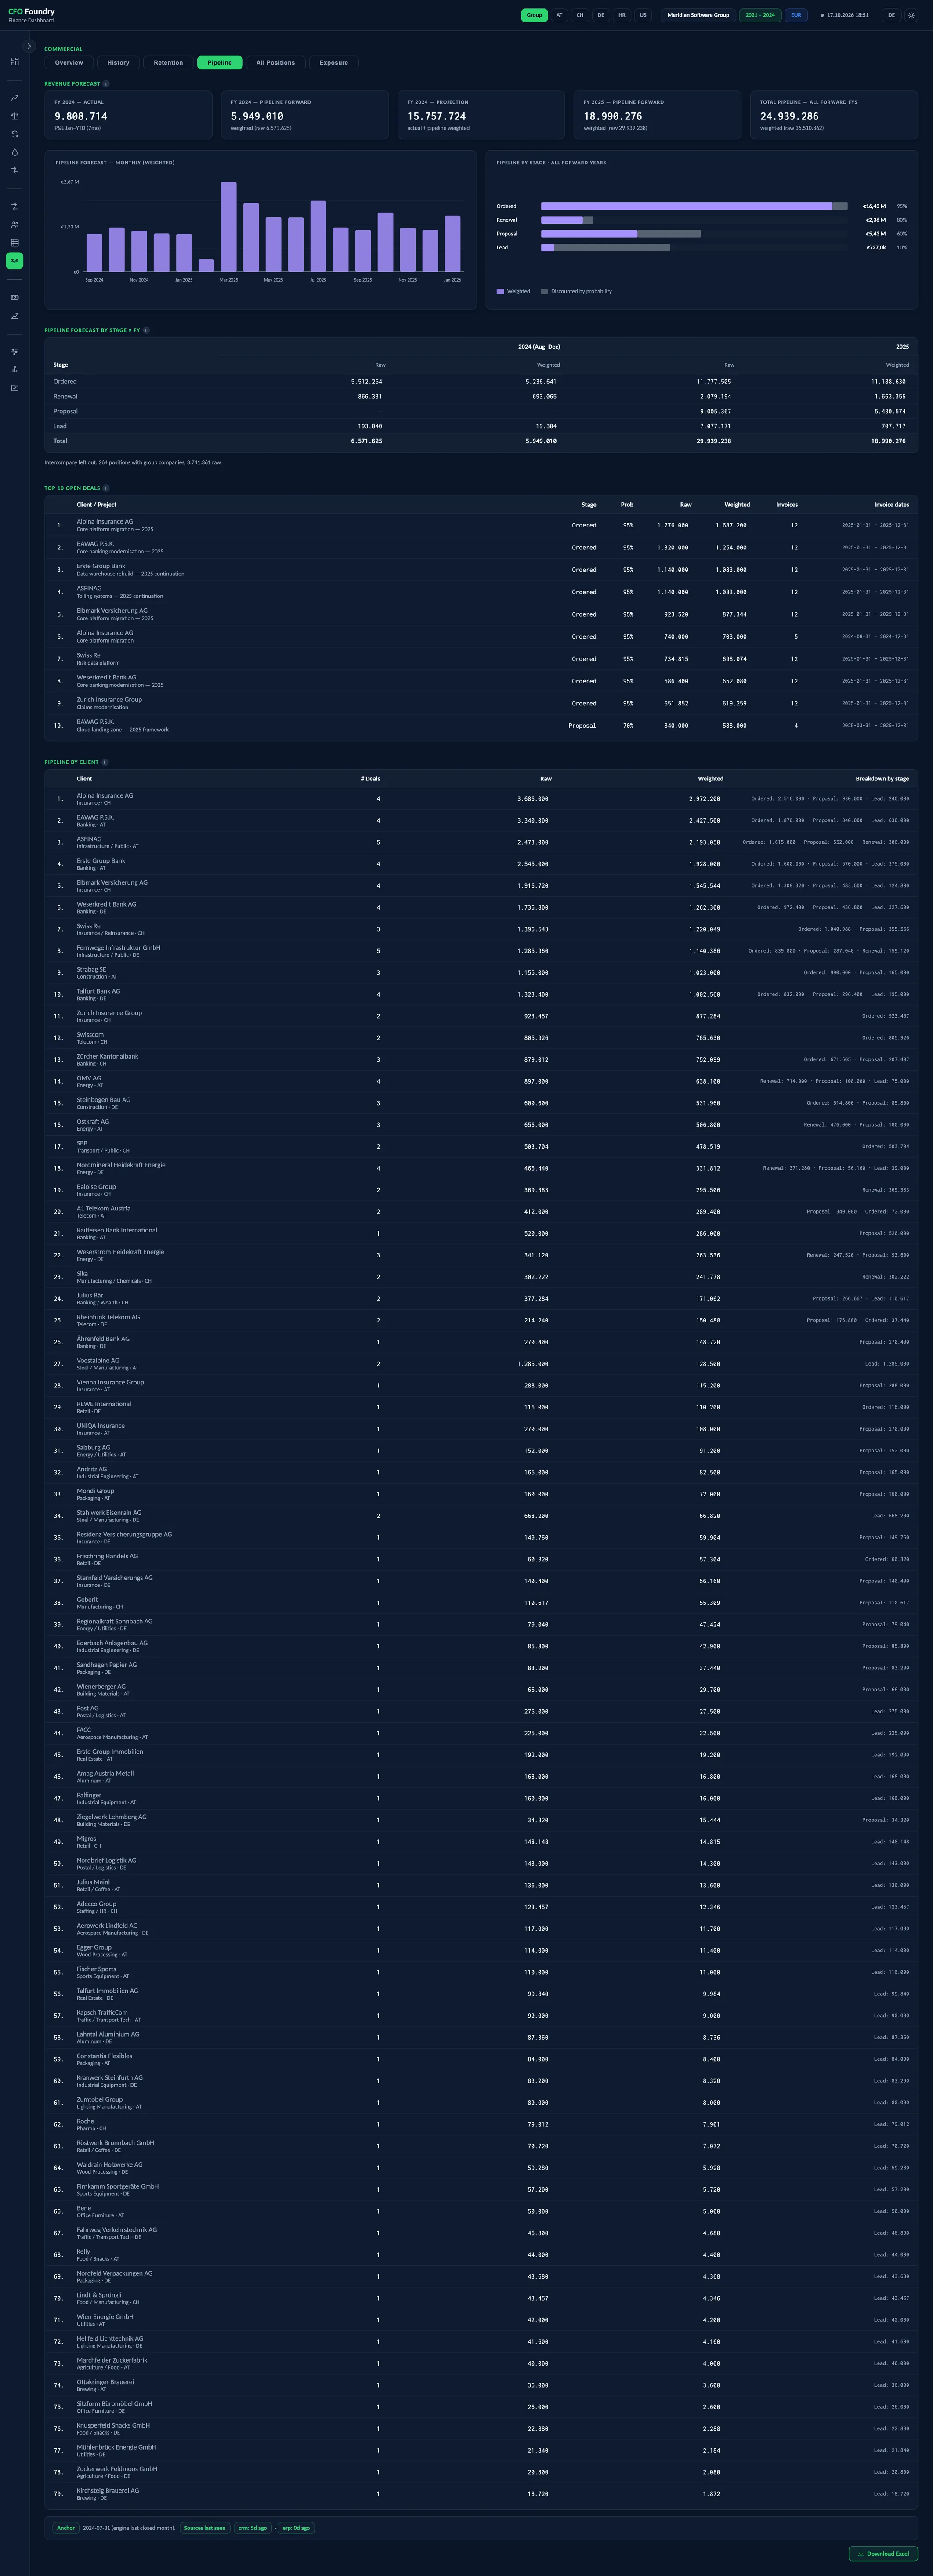
- 4 KPIs
- PIPELINE FORECAST BY STAGE × FY
- TOP 10 OPEN DEALS
- PIPELINE BY CLIENT
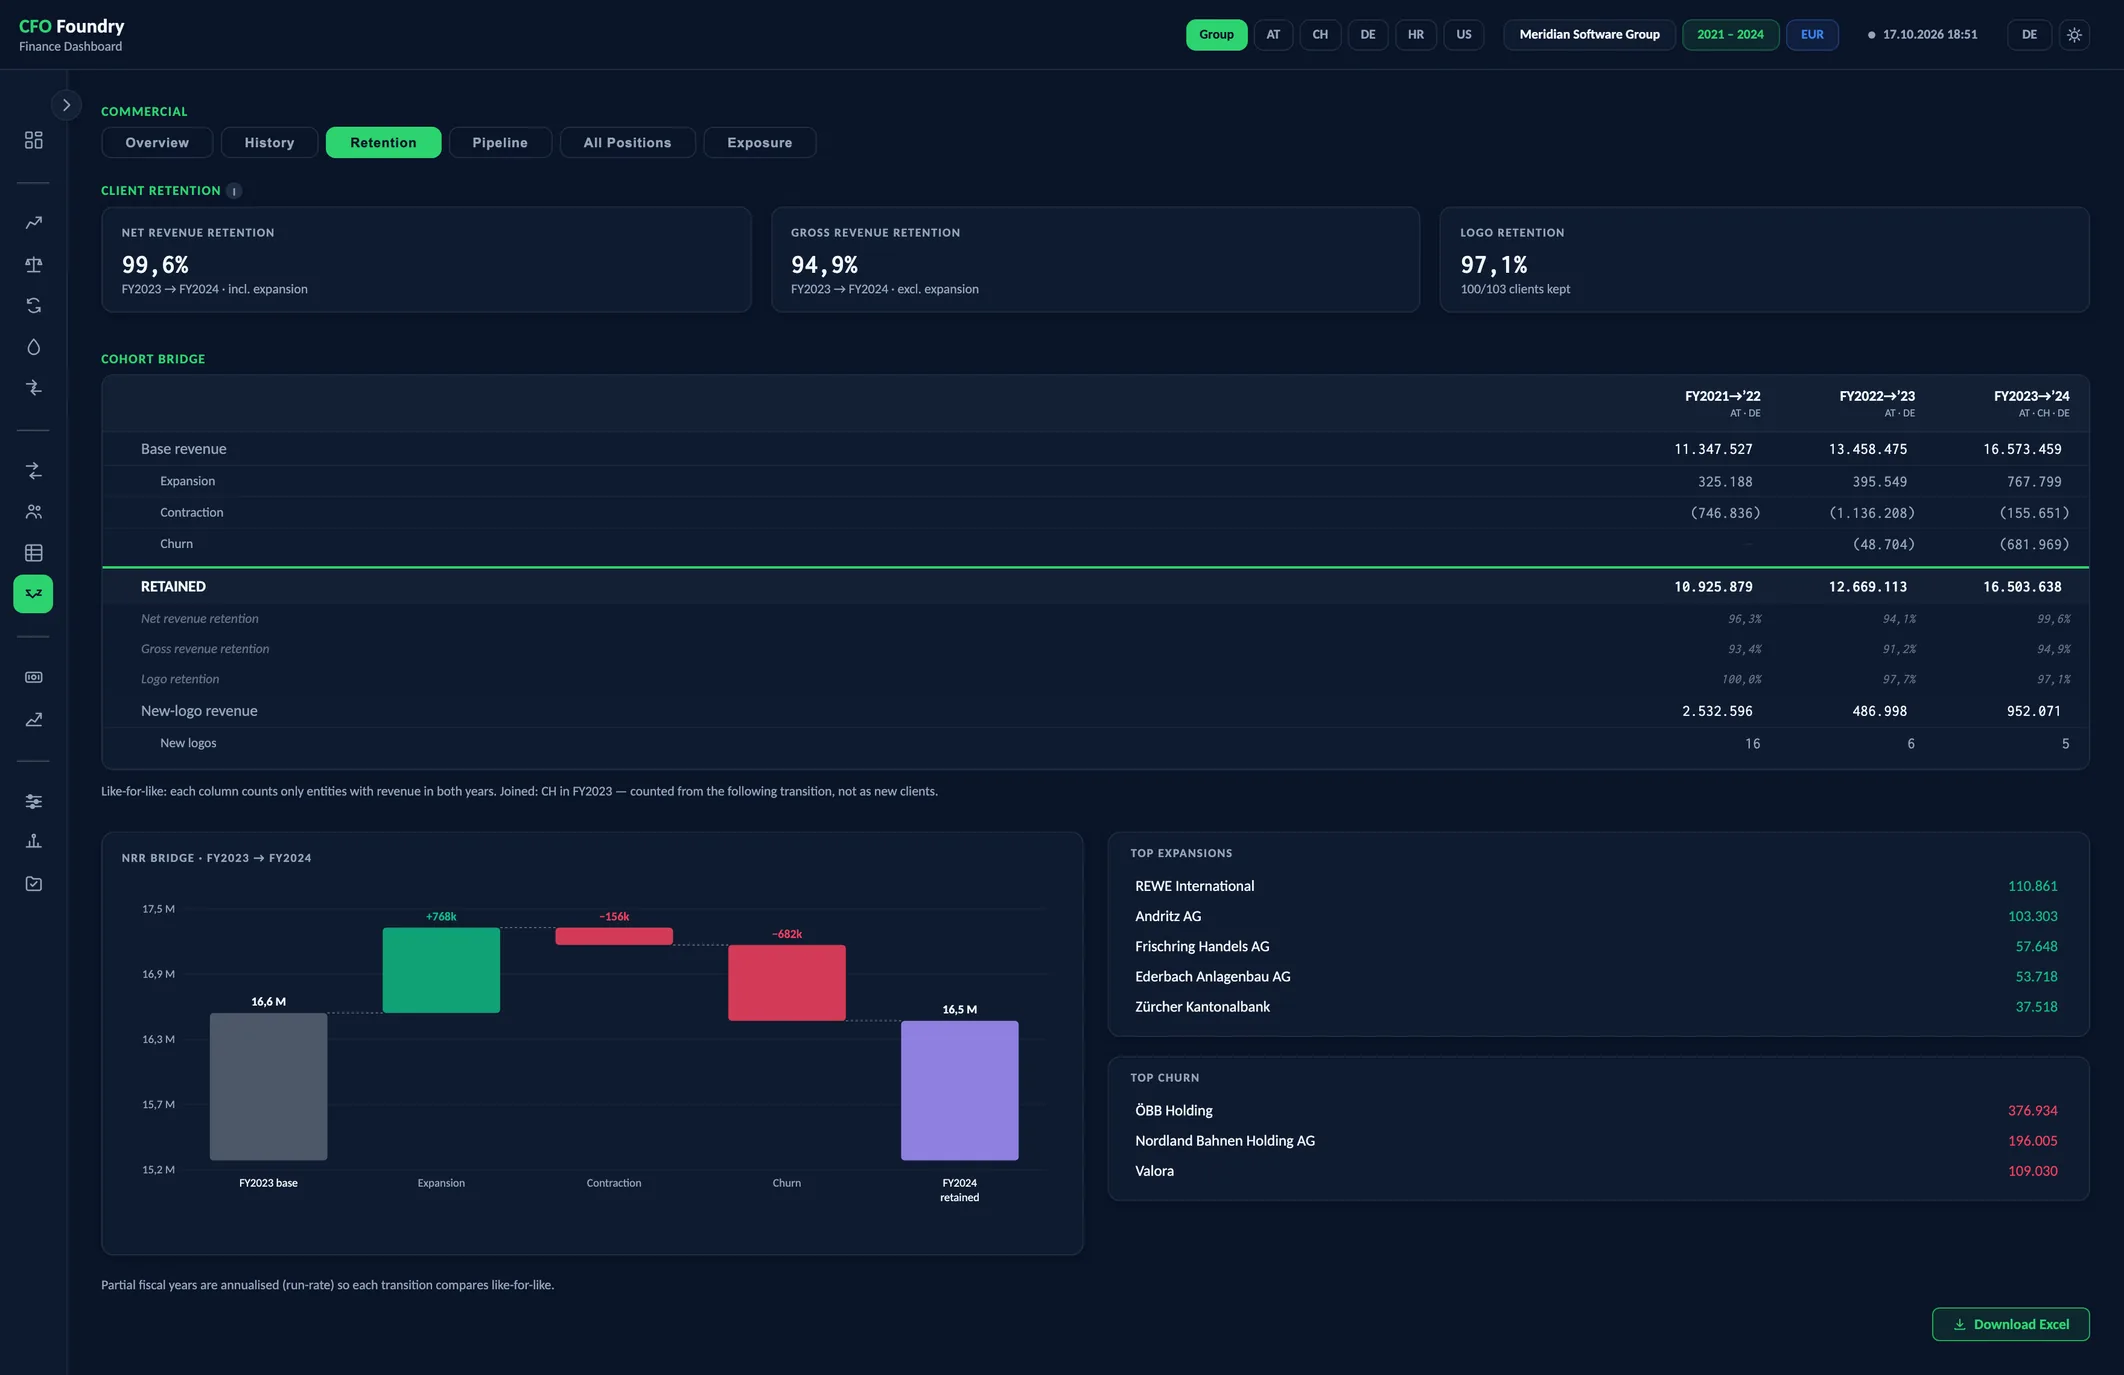
- 3 KPIs
- COHORT BRIDGE
Meridian is a fictional demo company. All figures are sample data.
Key questions
How concentrated is the revenue?
The top-10 concentration is the ten largest clients' share of the fiscal year's invoiced revenue, beside the number of active clients.
Does the revenue stay?
Net and gross revenue retention compare each client's revenue with the year before, split into expansion, contraction and churn.
What is already in the pipeline?
The pipeline stands raw and probability-weighted, by stage and by month, and the weighted part is added to the year's actual revenue.
Who the revenue comes from, and what is already in the pipeline
Six tabs: overview, revenue history, retention, pipeline, all positions and exposure. Active clients, top-10 concentration and service-line mix by fiscal year. Net and gross revenue retention. The pipeline raw and probability-weighted, by stage and by month.
Commercial
- Overview
- History
- Retention
- Pipeline
- All Positions
- Exposure
- Active clients
- Top-10 concentration
- YoY (annualised)
- Weighted pipeline
- Net revenue retention
- Gross revenue retention
- Logo retention
- FY — actual
- FY — pipeline forward
- FY — projection
- Total pipeline — all forward FYs
- Revenue by fiscal year · P&L
- Revenue by service line · invoiced
- Client concentration · invoiced
- NRR bridge
- Pipeline forecast — monthly (weighted)
- Pipeline by stage · all forward years
- Revenue by entity · P&L
- Revenue by industry · invoiced
- By segment
- Top 10 clients
- Revenue by service line
- Revenue by type (T&M / fixed / recurring)
- Client × fiscal year matrix
- Reconciliation to trial balance
- Cohort bridge
- Pipeline forecast by stage × FY
- Top 10 open deals
- Pipeline by client
- All pipeline positions
Amounts from the P&L, composition from the invoices
Revenue by fiscal year is the P&L's revenue. The invoice history, one row per invoice, supplies the composition: which client, which service line, which industry. Charts built from it say so in their title, marked as invoiced.
The History tab breaks revenue down by service line, by type (time and material, fixed price, recurring) and by client and fiscal year. Its last table sets each year's invoices against the P&L revenue and shows the difference as an amount and a percentage.
In the group view, invoices to sister companies are taken out and stated per year, in line with the group P&L after intercompany elimination. The Exposure tab adds revenue by entity, by industry and by client segment.
Retention from one year to the next
Retention starts from the clients with revenue in the prior year. Each client's revenue in the current year is set against it:
- Gross revenue retention: prior-year revenue less churn and contraction, over prior-year revenue
- Net revenue retention: the same, plus the expansion of clients who bought more
- Logo retention: the share of prior-year clients still buying
A fiscal year still running is compared with a full year at the same pace. The cohort bridge runs from the prior year's revenue through churn, contraction and expansion, with new clients on a line of their own outside the ratios. The largest expansions and losses are listed by client.
In the group view, years are compared like for like, and an entity that joins the group is named.
The pipeline, raw and weighted
The pipeline comes from the company's own exports, one row per expected invoice. Exports from several systems, such as a CRM and an ERP, are read and combined.
Each row sits in one of four forward stages: ordered, renewal, proposal and lead, and is weighted by its probability.
The Pipeline tab shows the current fiscal year as actual revenue, weighted pipeline still to come and their sum, the projection for the year. Further down: the weighted pipeline month by month, by stage and fiscal year, the ten largest open deals and the pipeline by client. All Positions lists every row.
Terms
- Active Clients
- Clients invoiced in the current fiscal year.
- Top-10 Concentration
- The ten largest clients' share of the fiscal year's invoiced revenue.
- Net Revenue Retention (NRR)
- This year's revenue from last year's clients, as a share of what they paid last year.
- Gross Revenue Retention (GRR)
- Net revenue retention without expansion: what is kept, at most 100%.
- Weighted Pipeline
- Each deal's amount times its probability of being won.
Data sources
- The invoice history of each entity, one file per fiscal year
- The client master: country, industry and segment per client
- The pipeline export, from one or several systems
- Revenue from the monthly trial balance, for the amounts and the reconciliation
FAQ
How is net revenue retention calculated?
Take last year's revenue from last year's clients, subtract what churned clients and shrinking clients took away, add what growing clients added, and divide by last year's revenue. New clients are left out.
What is customer concentration risk?
The share of revenue that depends on a few clients. Due diligence reads it as a risk to future revenue, so the top-10 share and the client ranking are among the first figures asked for.
How is a sales pipeline weighted?
Each deal's amount is multiplied by its probability of being won, so a signed order counts for more than an early lead.
Why do invoiced revenue and P&L revenue differ?
Accrued revenue for work not yet invoiced, deferred income and credit notes move the two apart. The History tab shows the difference year by year.
Get in touch
Describe your situation in a few lines. A reply typically follows within 1–2 business days.
To the Contact Form