Headcount, attrition and tenure
Who works in the company, how much of their time is sold, what they cost, and who joined and left over the last twelve months.
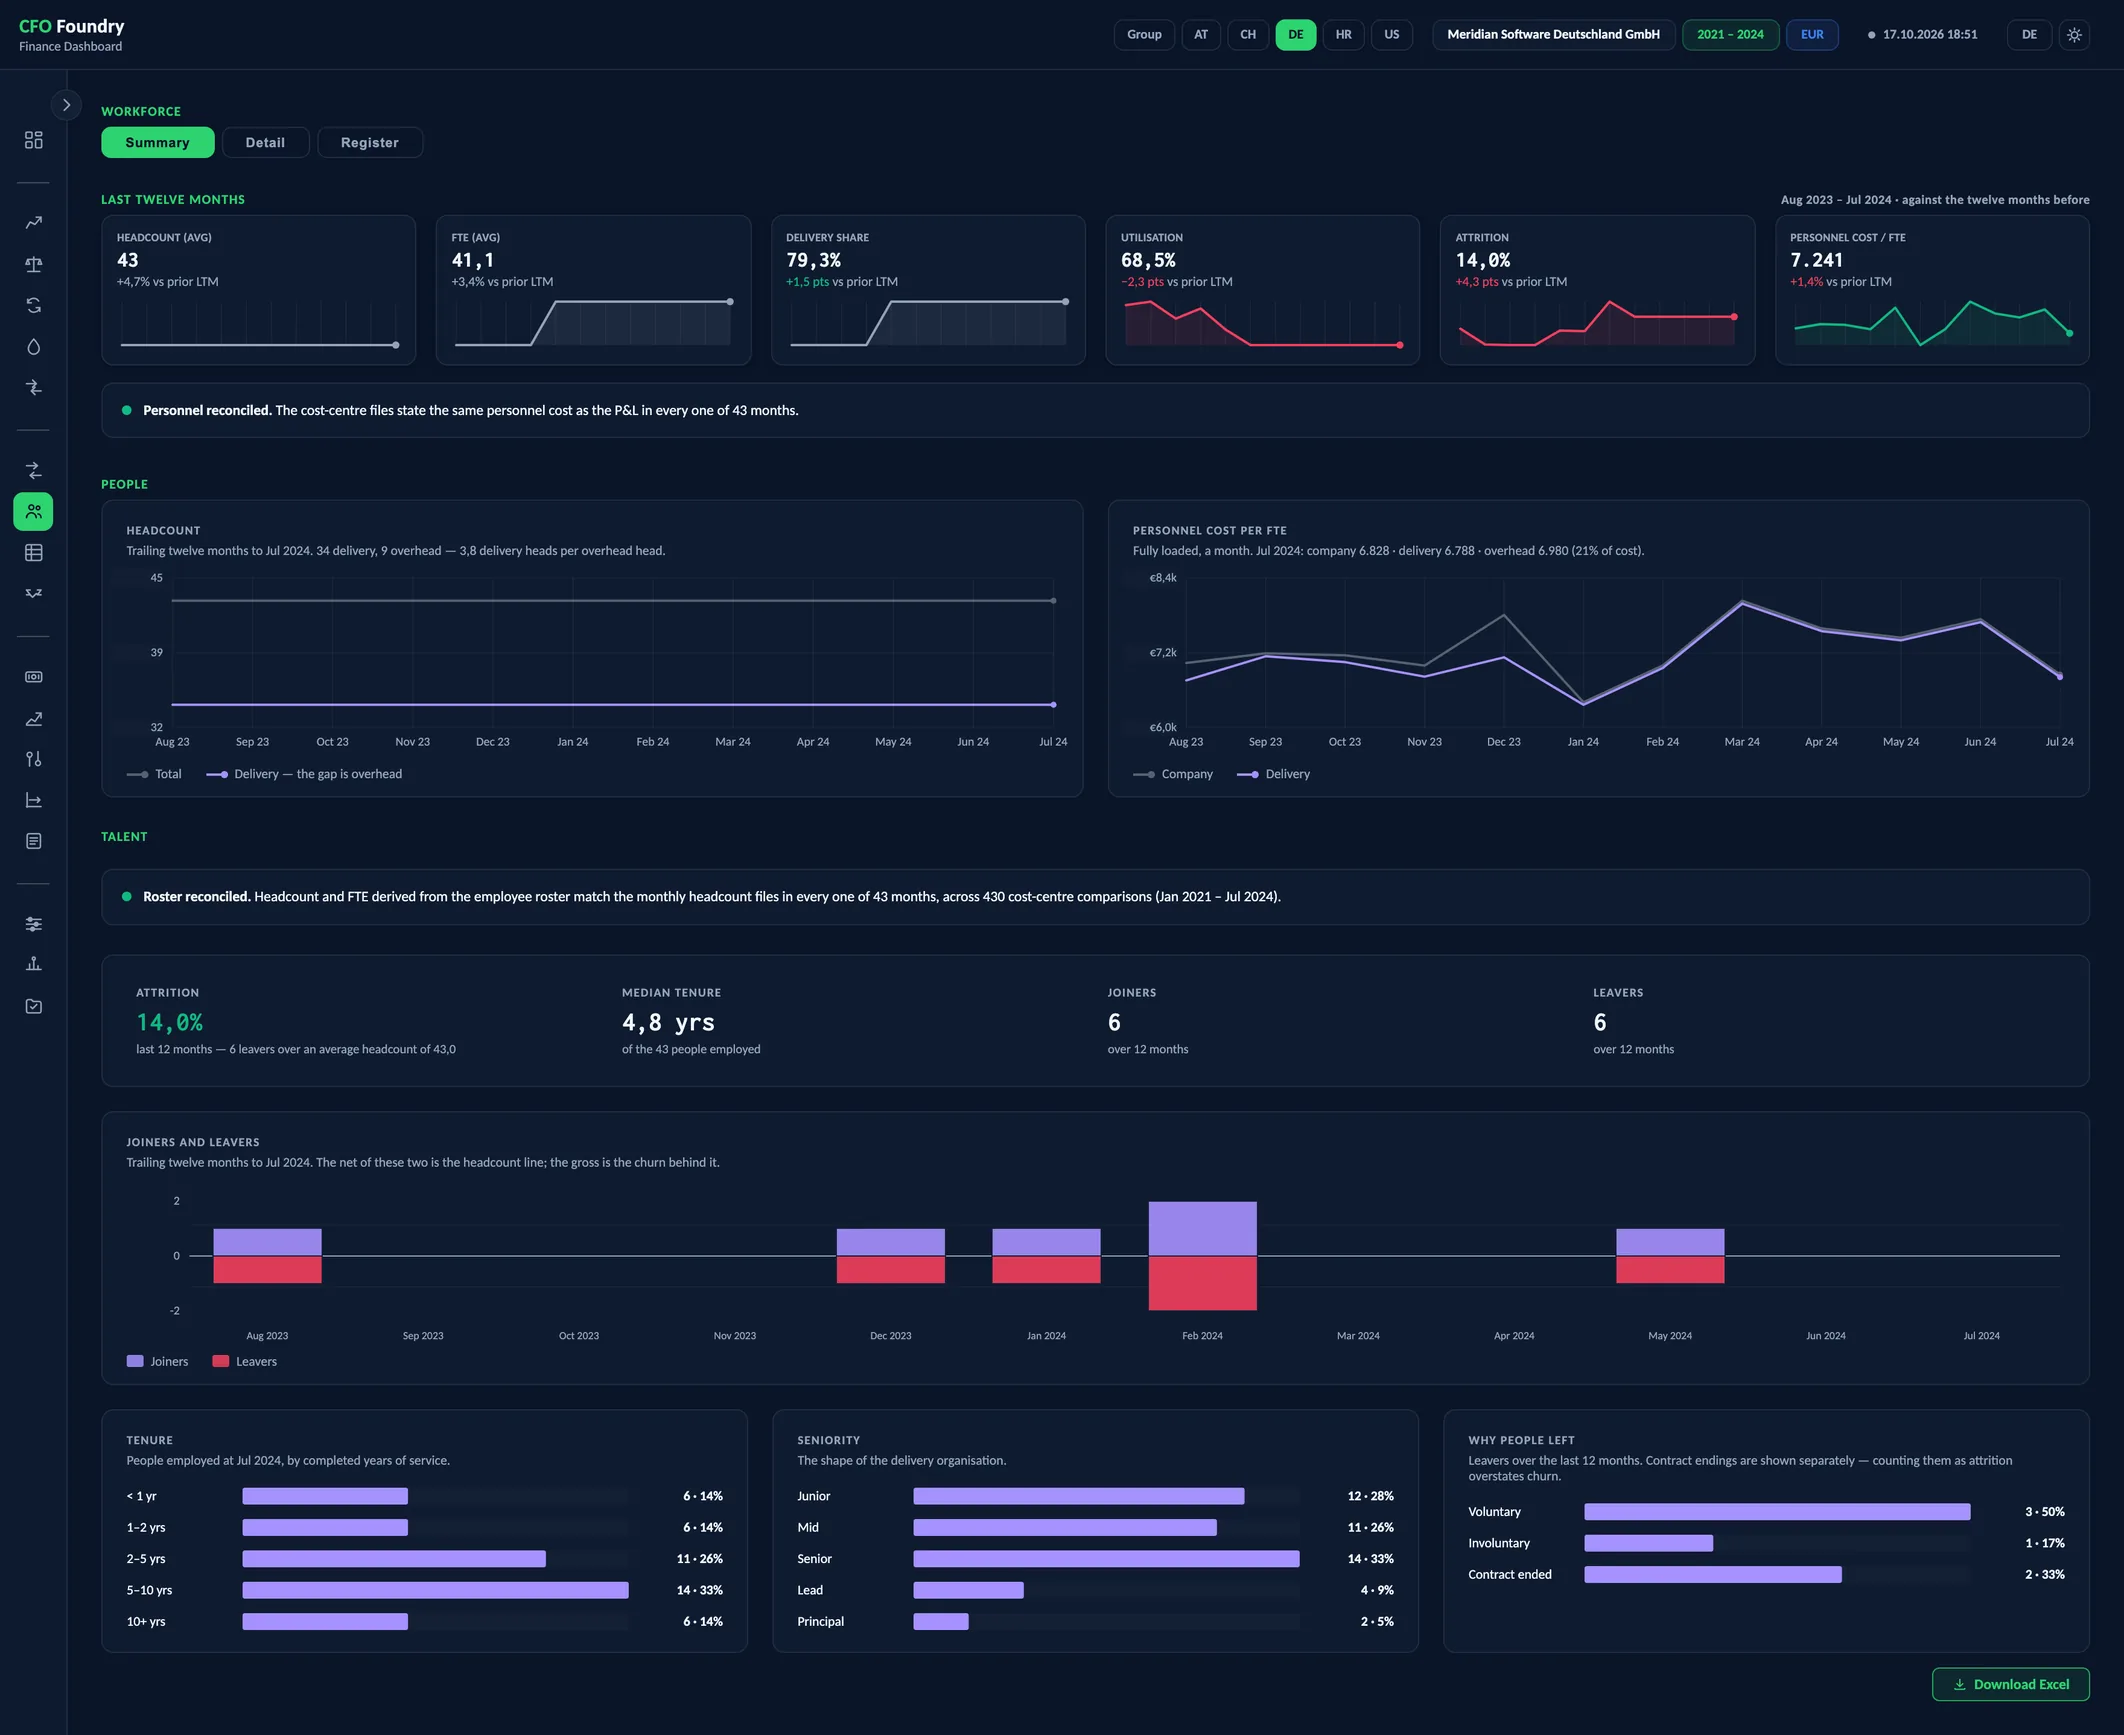
- 9 KPIs
- Headcount
- Personnel cost per FTE
- Joiners and leavers
- Tenure
- Seniority
- Why people left
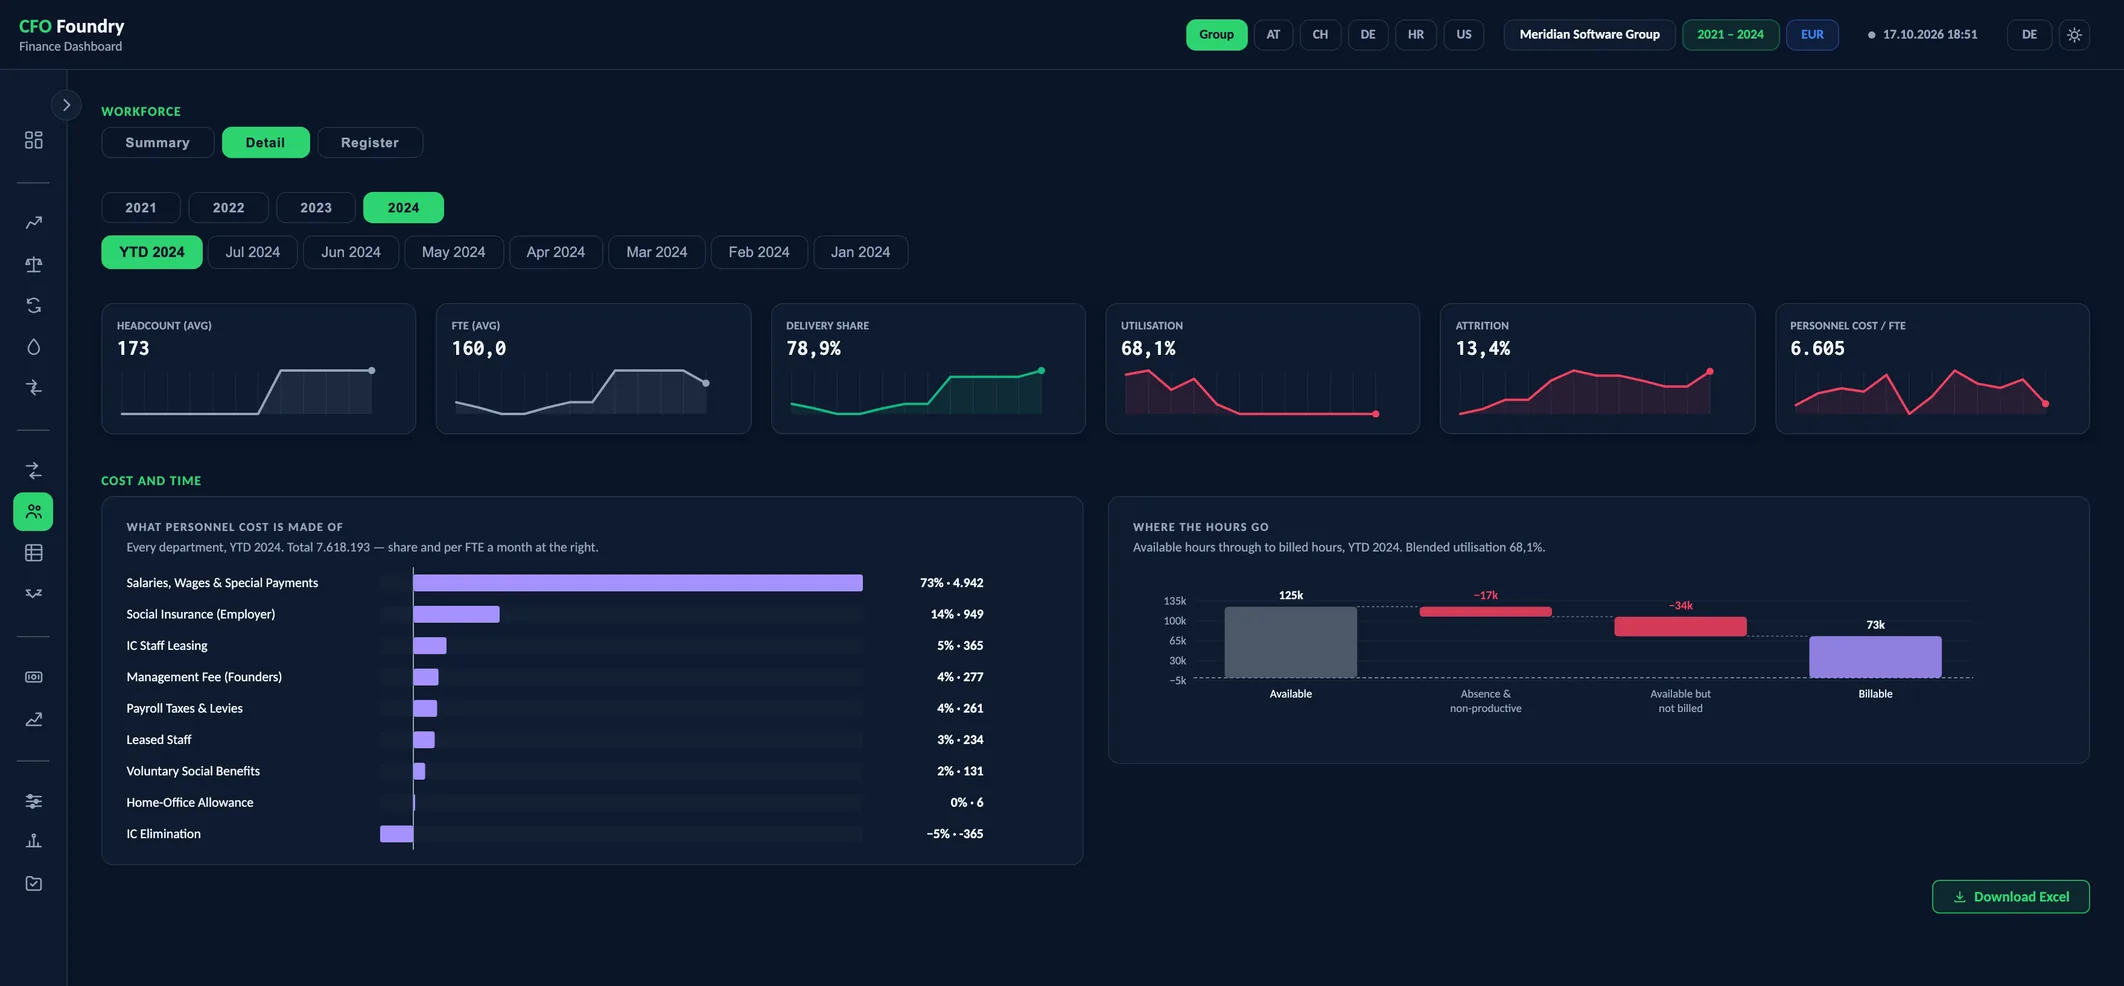
- 6 KPIs
- What personnel cost is made of
- Where the hours go
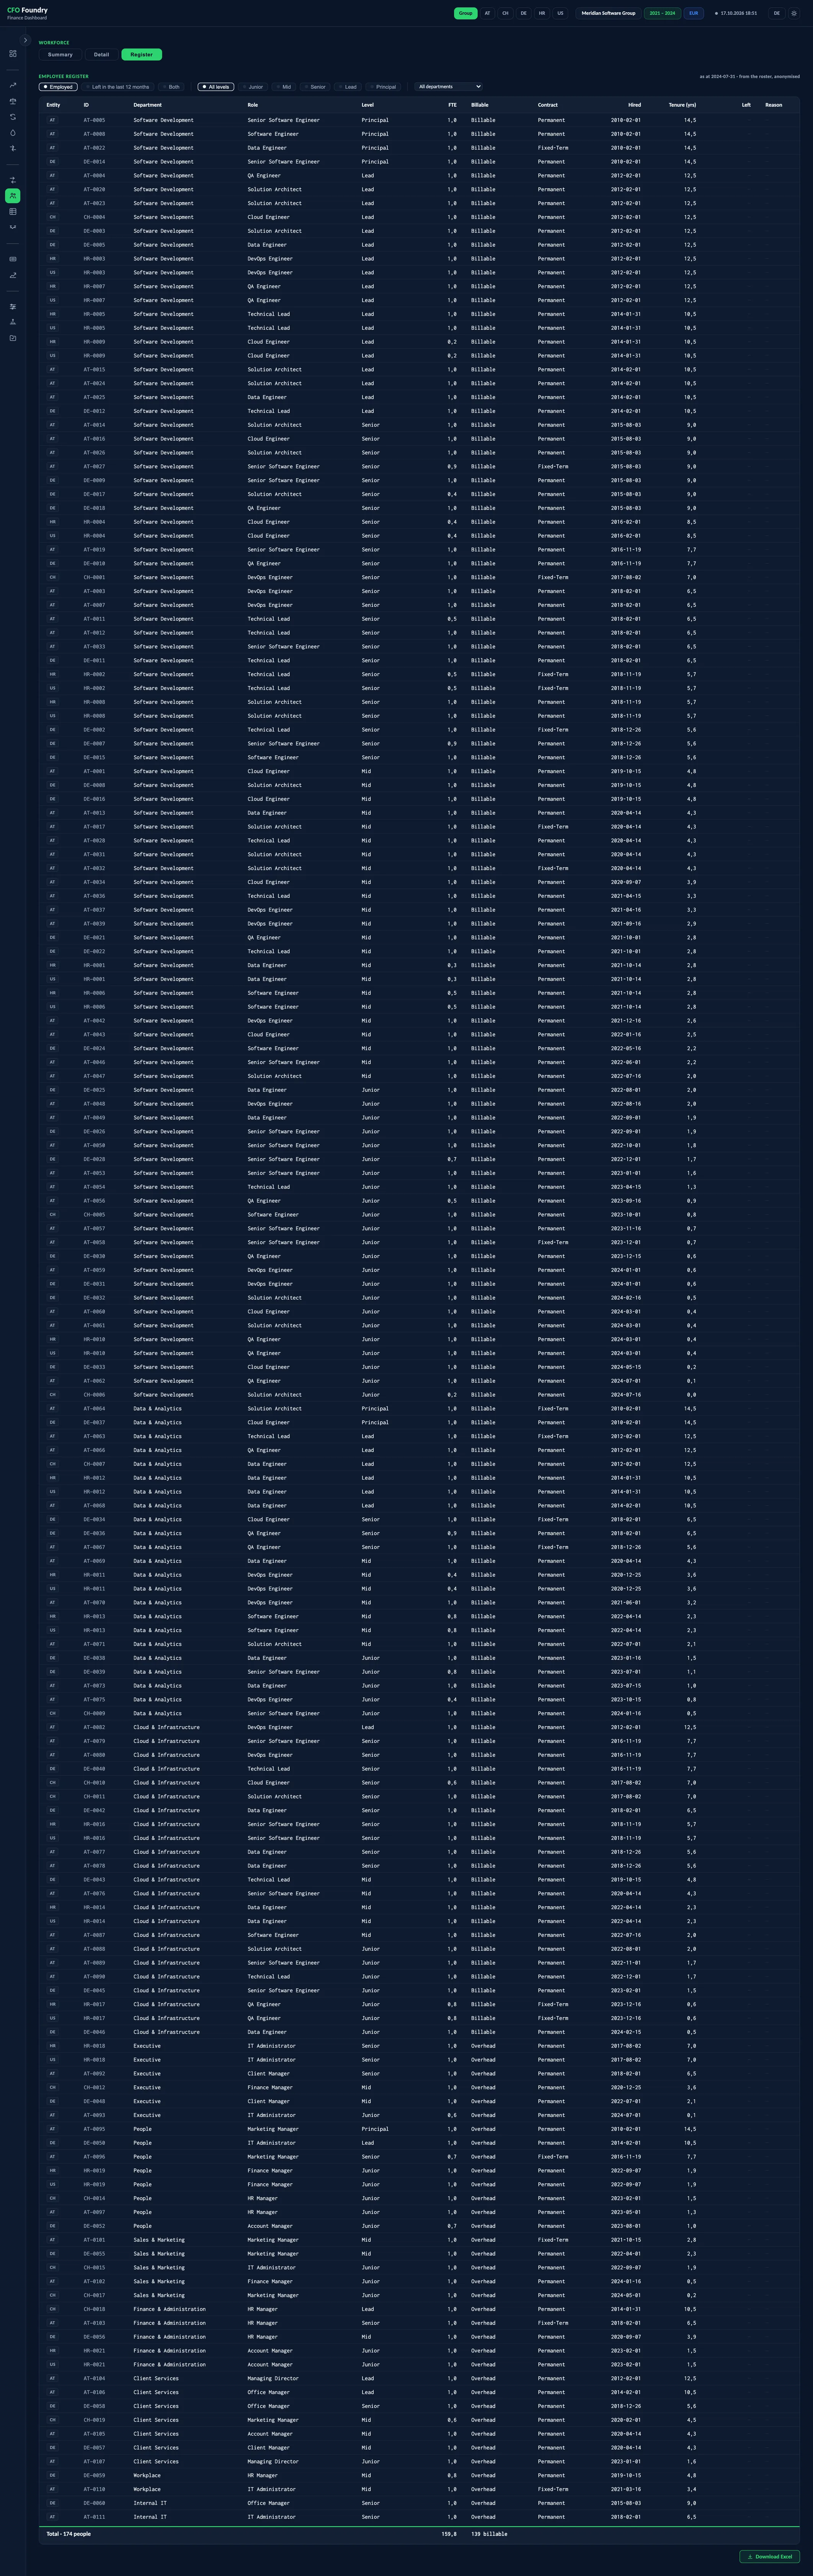
- EMPLOYEE REGISTER
Meridian is a fictional demo company. All figures are sample data.
Key questions
How many people work in delivery?
Headcount and FTE stand beside the delivery share: the FTE of the delivery departments as a share of all FTE.
How much of their time is sold?
Utilisation shows how much of the delivery departments' sellable time is billed. Detail shows where the other hours go.
Who is leaving, and why?
Attrition counts the leavers of the last twelve months against the average headcount of those months, with each reason for leaving counted apart.
People, attrition and tenure
Summary, Detail and Register. Attrition, median tenure and joiners against leavers, month by month, with contract endings counted apart from resignations. The roster is checked against headcount, and personnel cost against the P&L every month.
Workforce
- Summary
- Detail
- Register
- Headcount (avg)
- FTE (avg)
- Delivery share
- Utilisation
- Attrition
- Personnel cost / FTE
- Median tenure
- Joiners
- Leavers
- People
- Talent
- Cost and time
- Employee register
Summary, Detail and Register
Summary reads the latest month in the data. Six figures stand over the last twelve months against the twelve before: headcount, FTE, delivery share, utilisation, attrition and personnel cost per FTE. Below them, headcount and personnel cost per FTE run month by month, for the company and for delivery.
Detail reads the month or year chosen in the picker. It shows what personnel cost is made of, with each part per FTE and month, beside where the hours go: from available hours through absence and unbilled time to the hours billed.
Register lists the roster as at the latest month, one row per person, filtered by employed, left or both. Its columns come from the roster itself.
Headcount and FTE over several months are averages and are labelled as such.
Attrition and tenure from the roster
The roster lists everyone the company has employed, leavers included. Joiners, leavers and tenure all come from it, month by month.
- Joiners and leavers month by month, behind the net change in headcount
- Attrition over a trailing twelve months, against the average headcount
- Median tenure, and headcount by years of service: under one, one to two, two to five, five to ten, ten and more
- Headcount by seniority, from junior to principal
- Leavers by reason: voluntary, involuntary and contract ended
Tenure is measured at the month being viewed. The charts by seniority, exit reason and contract type appear once the roster carries that detail.
Two checks every month
The roster is compared with the monthly headcount files, per department and month. The result stands at the top of the talent section whether the two agree or not. An export of current employees only, without leavers, shows here first.
Personnel cost is measured twice: in the cost-centre files by department, and in the trial balance for the company. The two are compared every month, and a material difference is named on the summary with its month and, in the group view, its entity. Personnel cost per FTE for the company reads the P&L.
Terms
- FTE
- Full-time equivalent: headcount weighted by each person's working time.
- Realistic Hours
- The hours that could realistically be sold to clients.
- Utilisation
- The share of the delivery departments' sellable time that is billed.
- Delivery Share
- The FTE of the delivery departments as a share of all FTE.
- Attrition
- Leavers over the average headcount of the same window, annualised, over the last twelve months.
- Median Tenure
- The years of service of the person in the middle, with half the staff above and half below.
Data sources
- The employee roster of each entity, leavers included
- Monthly headcount and hours per cost centre
- The monthly cost-centre P&L, for personnel cost by department
- The monthly trial balance, for the company's personnel cost
FAQ
How is employee attrition calculated?
As the leavers of a period over the average headcount of the same period, annualised. CFO Foundry uses the last twelve months, so a growing or shrinking company is measured on the staff it actually had.
How is utilisation calculated?
As the share of the delivery departments' sellable time that is billed. The report shows it for the last twelve months against the twelve before.
Why must the roster include leavers?
Attrition and past headcount are read from hire and exit dates. A list of current employees only reads 0% attrition and understates every past month, and the check against the headcount files names it.
Which HR data is needed?
The employee roster, leavers included, and monthly headcount and hours per cost centre, as the HR and time-tracking systems export them. Detail such as seniority or the reason for leaving adds its own charts.
Get in touch
Describe your situation in a few lines. A reply typically follows within 1–2 business days.
To the Contact Form