Drivers, projection and statements
What the company earns over the next eighteen months at the drivers measured from its own history, and how the balance sheet and cash follow.
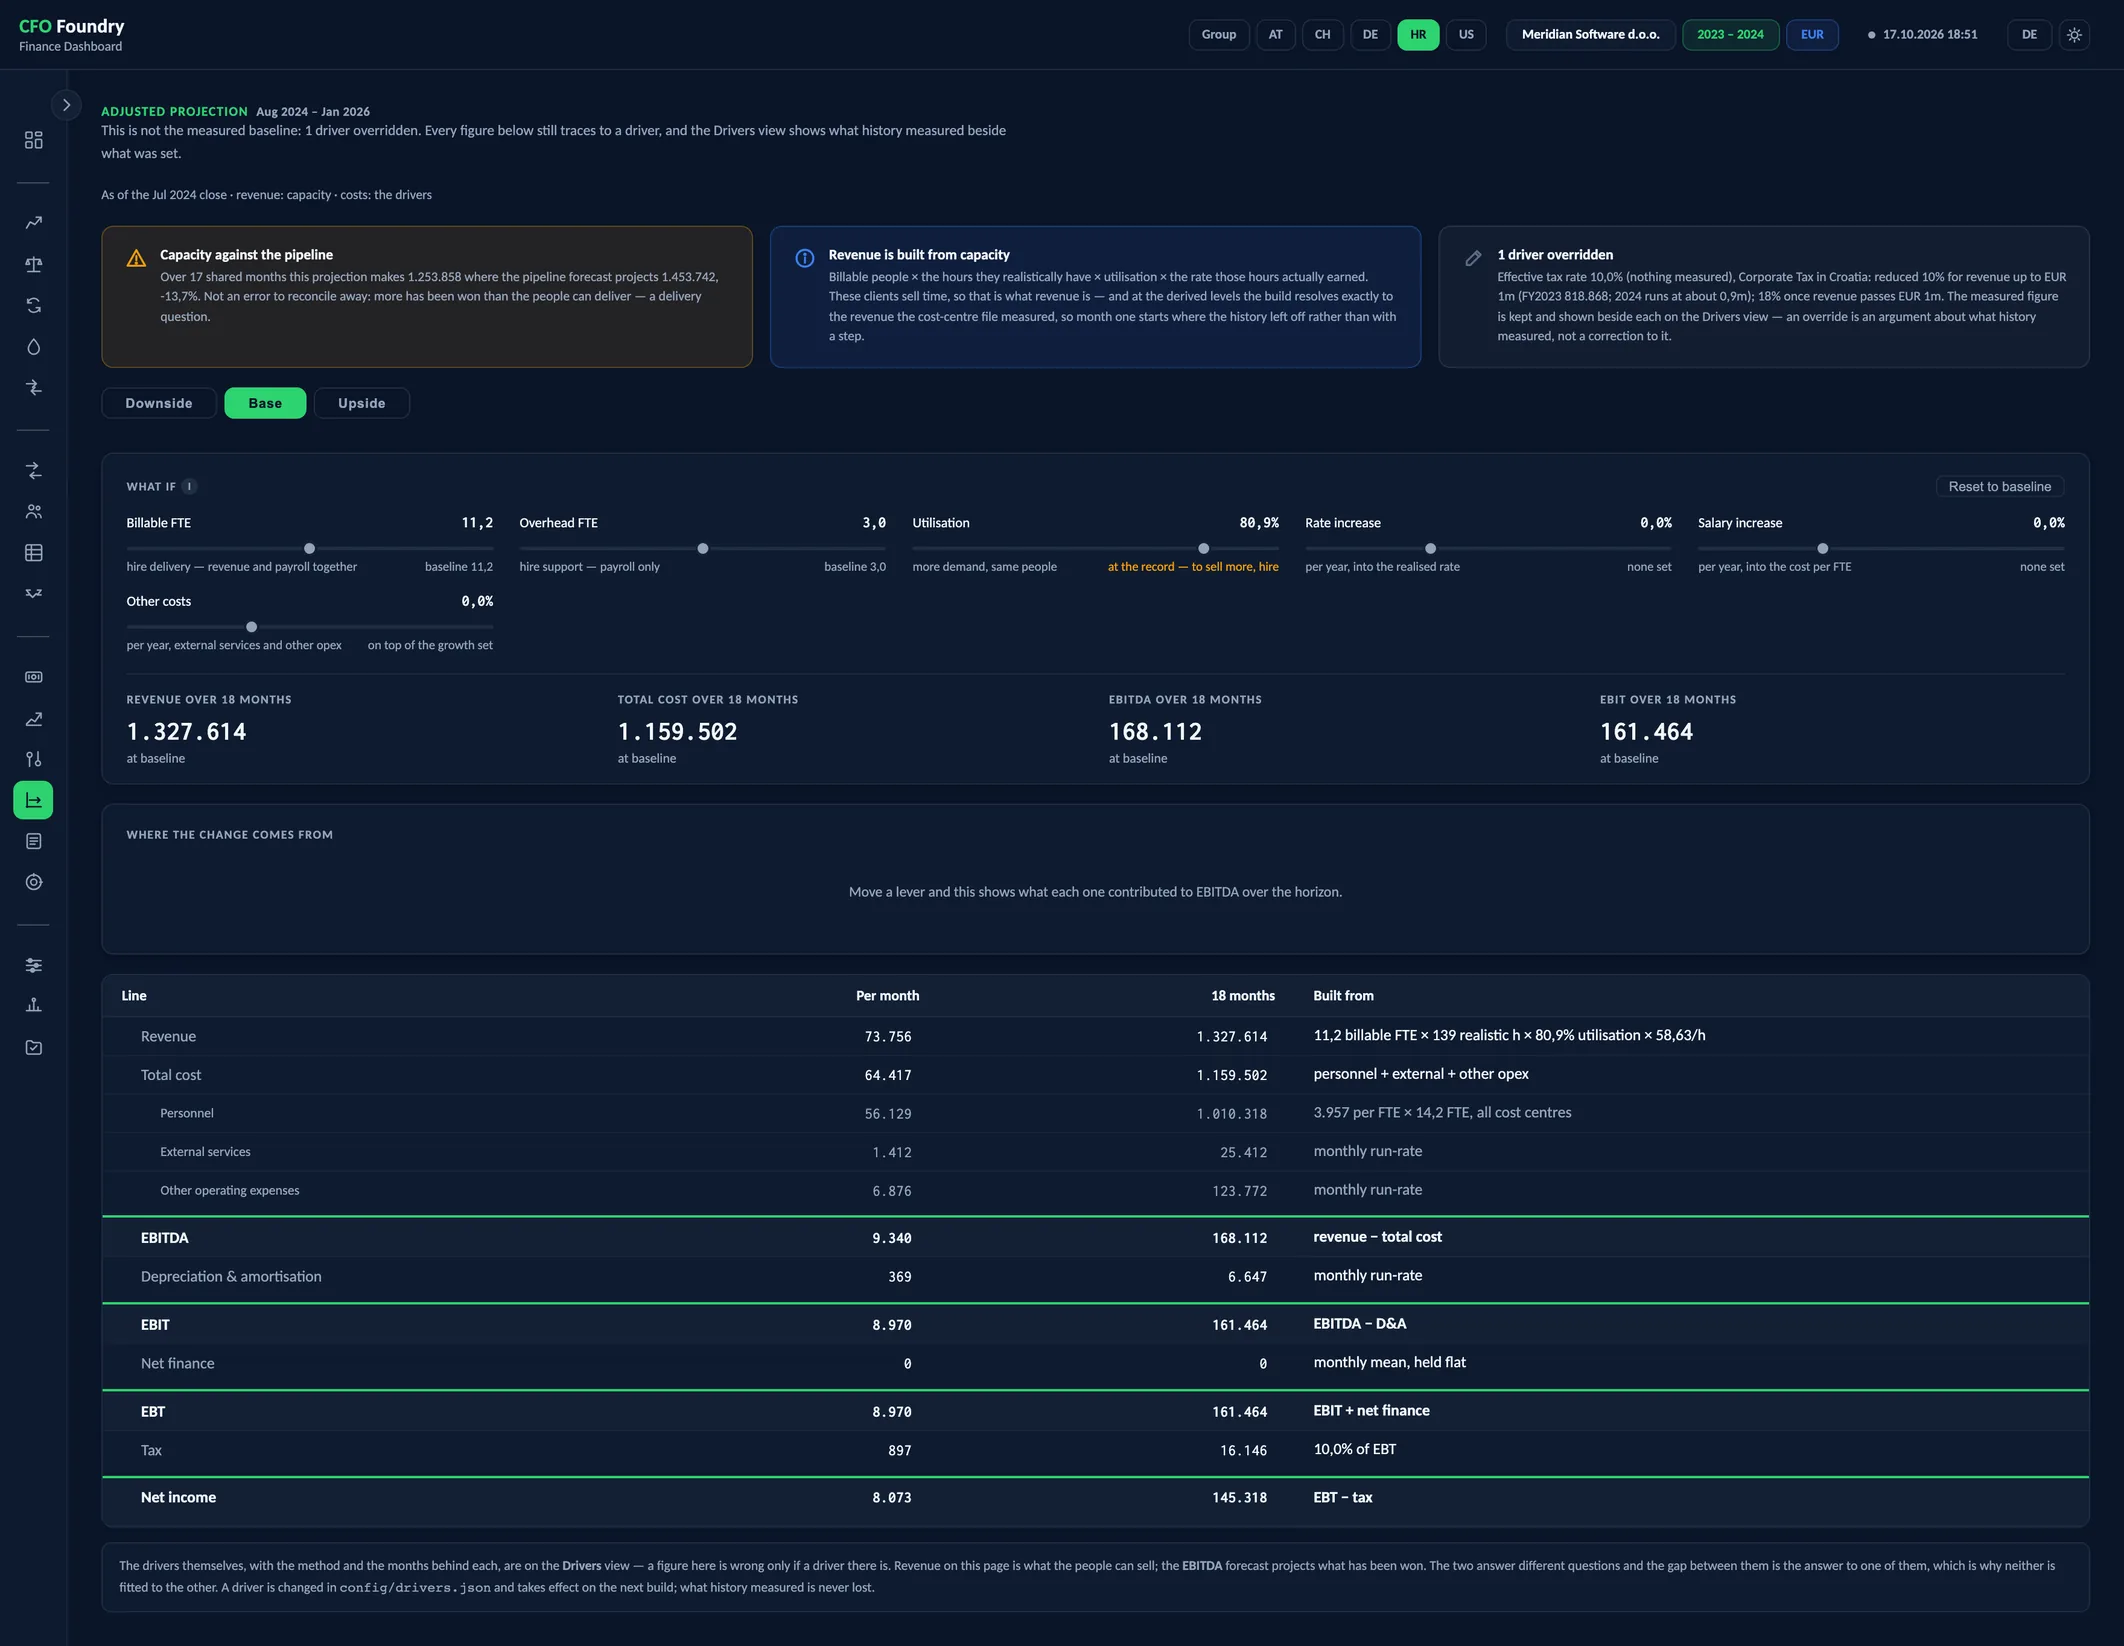
- 4 KPIs
- Where the change comes from
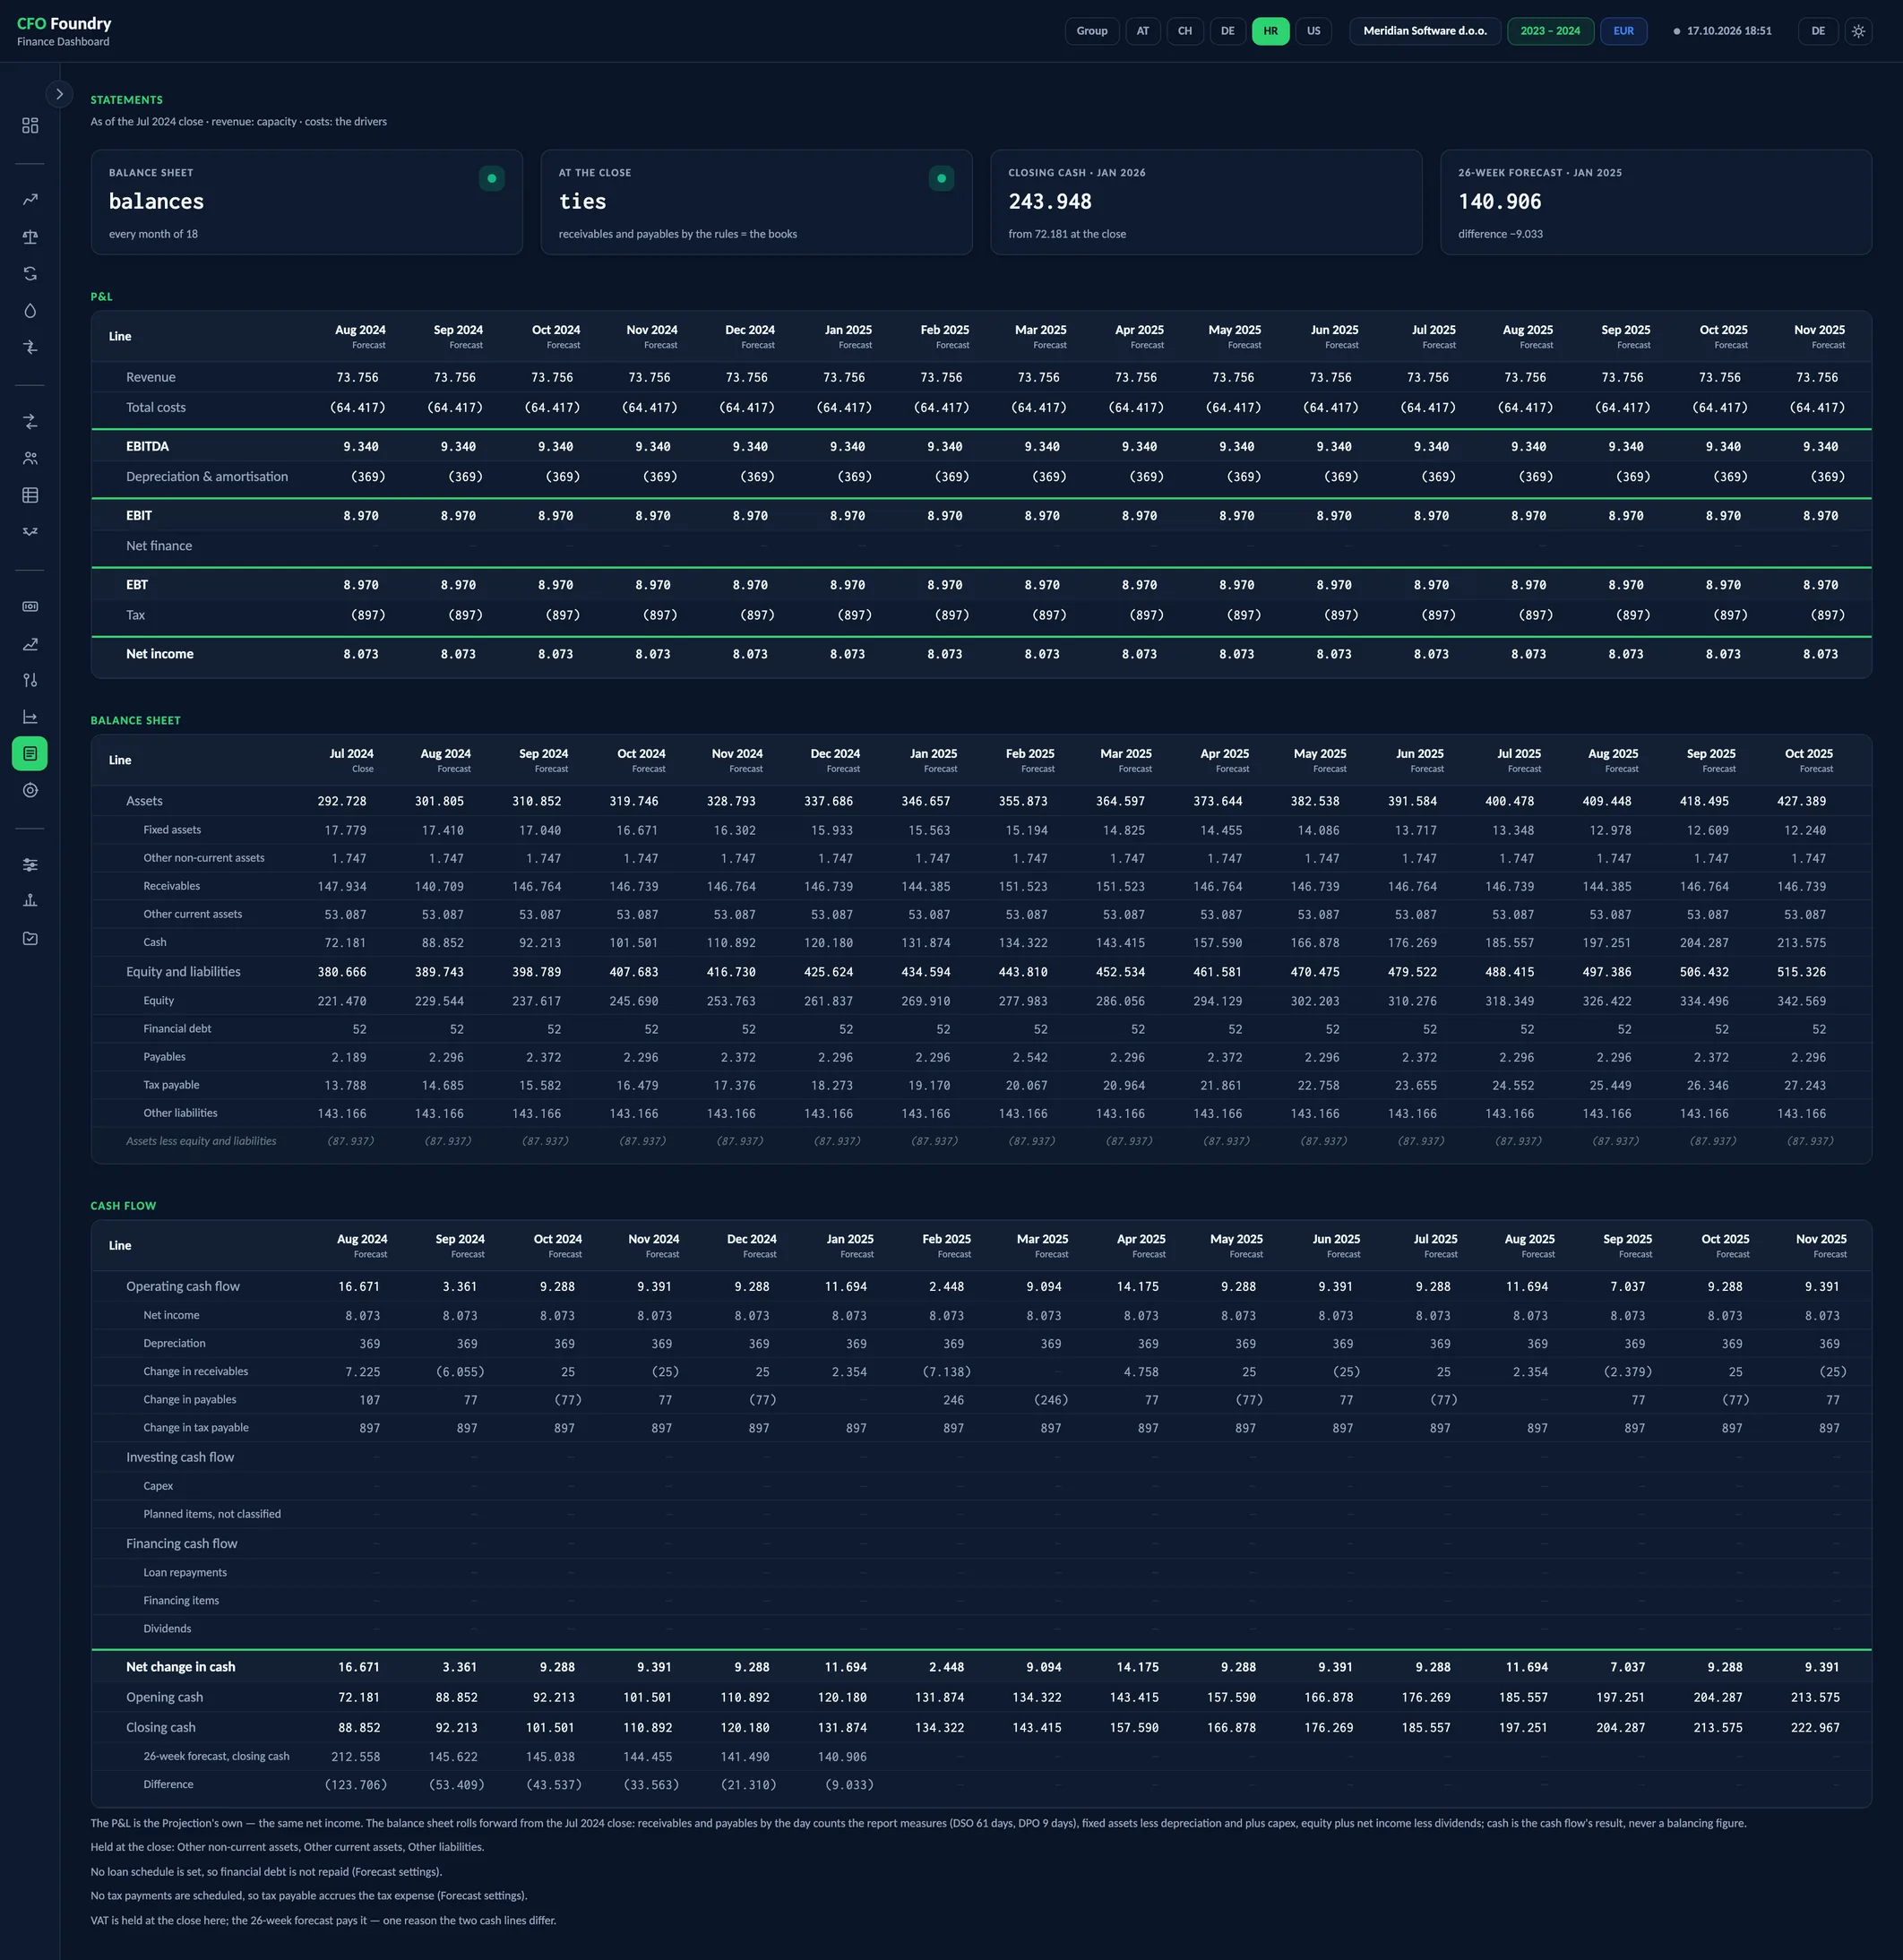
- 4 KPIs
- P&L
- BALANCE SHEET
- CASH FLOW
Meridian is a fictional demo company. All figures are sample data.
Key questions
What does the history say?
The Drivers view lists each driver with its value, method, period and source: headcount, hours, utilisation, the realised rate, cost per FTE, cost run-rates, DSO and DPO.
What would change the result?
Six levers on the Projection show what a change in headcount, utilisation, rates, salaries or other costs does to EBITDA, lever by lever.
Do the three statements agree?
Cash is the result of the projected cash flow, so a balance sheet that balances in every month is a check on the model.
Projected P&L, balance sheet and cash flow
The drivers are measured from the company's own history: headcount, utilisation, rates and payment days. The Projection shows what six levers would change. The projected P&L, balance sheet and cash flow are computed per entity from the same drivers. Downside, Base and Upside switch the forecast views together.
Statements
- Balance sheet
- At the close
- Closing cash
- 26-week forecast
- P&L
- Balance sheet
- Cash flow
Drivers
- Projection drivers
Projection
- Downside
- Base
- Upside
- Revenue over 18 months
- Total cost over 18 months
- EBITDA over 18 months
- EBIT over 18 months
- Where the change comes from
Platform
- Scenarios: Downside, Base and Upside: driver changes run through the engine, switched together on every forecast.
Drivers measured from the history
Most drivers are measured from the company's own history: billable and overhead FTE, realistic hours per FTE, utilisation, the realised hourly rate, cost per FTE, the run-rates of external services and other operating costs, depreciation, DSO and DPO.
A few figures have no history to measure them: the rate increase, the salary increase, the growth of external services and other operating costs, and the effective tax rate. A person states each one with a reason, and each stays empty until then.
A measured driver can be corrected. The correction stands beside the measured figure with its reason, the Drivers view shows both with the difference, and the Projection names what was changed.
Revenue built from capacity
The Projection composes a monthly P&L over eighteen months from the drivers:
- Revenue, from the team's billable capacity
- Personnel, external services and other operating costs
- EBITDA, depreciation, EBIT, net finance and, once a tax rate is set, tax and net income
The projection continues where the history ended. A growth rate, a planned change or a moved lever changes the months that follow, and each is named on the page.
Where there are no hours to measure capacity, the view says so.
Six levers and three scenarios
The six levers are billable FTE, overhead FTE, utilisation, rate increase, salary increase and other costs. A moved lever recalculates the page at once and marks it as simulated. Nothing is saved, and a reload returns to the baseline.
A chart beside them walks from the baseline EBITDA through each moved lever to the simulated EBITDA. The utilisation lever marks the best month on record.
Downside, Base and Upside are named sets of driver changes, run through the same engine. Downside and Upside stay empty until someone states them. Choosing a scenario on any forward view switches the Projection and both forecasts together.
Balance sheet and cash flow rolled forward
The Statements view carries the Projection's P&L into a balance sheet and a cash flow statement, month by month and per entity. The balance sheet starts at the last close, and each line moves with what drives it:
- Receivables and payables: with the projected revenue and purchases, at the measured DSO and DPO
- Fixed assets: depreciation and planned capital spending
- Financial debt: the loan schedule and loans drawn or repaid
- Tax payable: the tax charge and scheduled tax payments
- Equity: net income and dividends
Every other line is held at the close and named.
Cash is what the cash flow statement produces, and the cards at the top say whether the balance sheet balances. The cash flow closes with the 26-week forecast's cash at each month-end and the difference to it.
Terms
- Driver
- A figure the projection is built from, such as utilisation or cost per FTE, measured from the history or stated by a person.
- Realised Rate
- What a billed hour actually brought in.
- Lever
- A what-if on the Projection page, applied to the drivers and saved nowhere.
- Scenario
- A named set of driver changes, re-run through the projection and both forecasts.
- Three-Statement Model
- A projection in which the P&L, the balance sheet and the cash flow are linked, so that cash results from the other two.
Data sources
- The monthly trial balance of each entity
- Monthly headcount and hours per cost centre
- Growth rates, the tax rate and corrections, each stated with a reason
- Planned changes, the loan schedule and scheduled tax payments
FAQ
What is a driver-based forecast?
A forecast built from the operating figures behind the result, such as headcount, utilisation, hourly rate and cost per FTE, so that each change can be traced to the driver that moved.
What is a three-statement model?
A projection that links the P&L, the balance sheet and the cash flow. Net income flows into equity, working capital and capital spending into the cash flow, and cash ties the balance sheet.
Why project receivables from DSO?
Receivables follow revenue. Projected at the DSO the company actually shows, they move with the revenue forecast, and the cash flow takes up the change.
Where do the growth assumptions come from?
A person states them with a reason. The historical growth rate is shown beside them for reference, and the projection uses only what was stated.
Get in touch
Describe your situation in a few lines. A reply typically follows within 1–2 business days.
To the Contact Form