The monthly profit and loss statement
Every month of every year in one statement, with its margins, the prior year beside it and the last twelve months a buyer prices on.
- 4 KPIs
- PROFIT & LOSS STATEMENT
- Configure
- Statement layout
Meridian is a fictional demo company. All figures are sample data.
Key questions
Where did revenue and margin go this year?
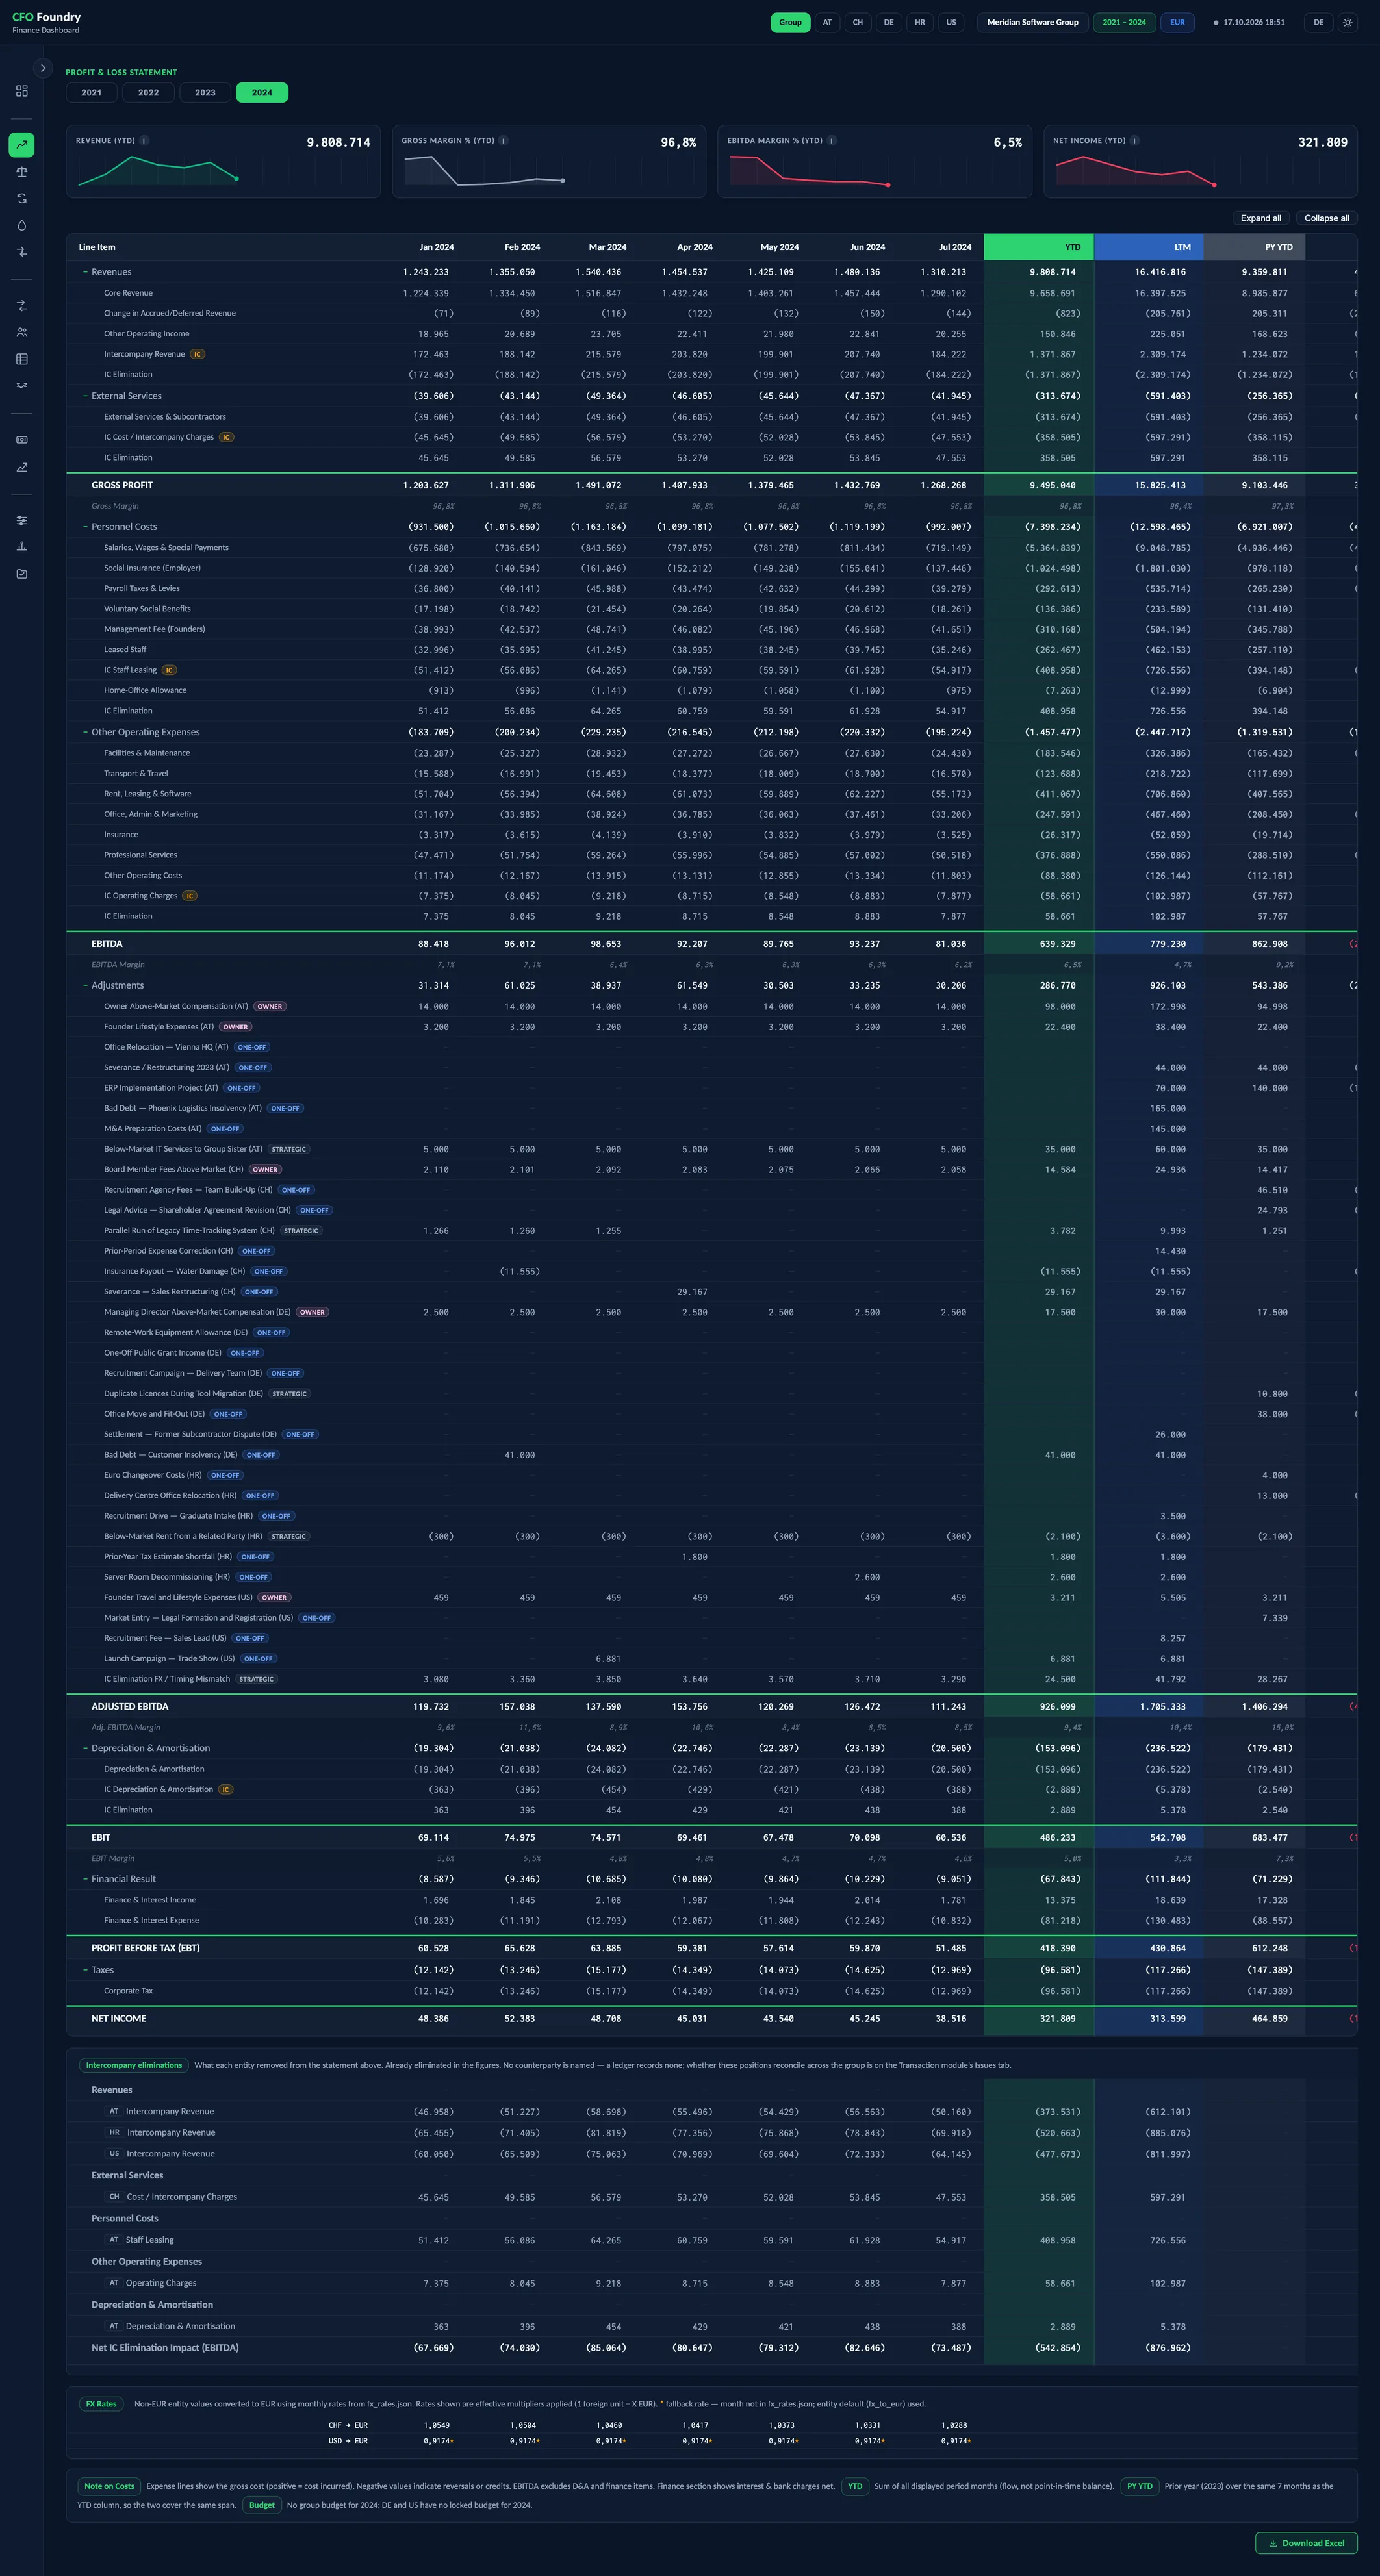
Each month stands in its own column, with the year to date beside it and the margin rows under each subtotal.
Is it better than last year?
The prior-year column covers the same months as the year to date, followed by the change as an amount and as a percentage.
What did the last twelve months earn?
In a part year, an LTM column sums the last twelve months, reaching back into the prior year.
Multi-year P&L with prior year and LTM
Collapsible sections, margin rows and PY / Δ / Δ% columns. A part year shows its YTD with the last twelve months beside it. Line names and order follow the company's own layout. Every line traces back to the trial balance.
P&L
- Revenue (YTD)
- Gross Margin % (YTD)
- EBITDA Margin % (YTD)
- Net Income (YTD)
- Profit & loss statement
The structure of the statement
Every account of the trial balance is mapped to one line of the CFO Foundry standard chart. The lines sit in seven sections, and the subtotals between them are computed:
- Revenues, less external services and subcontractors, give gross profit
- Less personnel costs and other operating expenses, EBITDA
- Less depreciation and amortisation, EBIT
- With the financial result, EBT, and after taxes, net income
In a services business the people are the business, so internal staff sit in personnel below gross profit. Gross margin, personnel and other operating expenses as a share of revenue, EBITDA margin and EBIT margin follow the subtotals they belong to.
Each section opens and closes on its own, and Expand all and Collapse all set the whole statement at once.
Every month from the trial balance
Every month is read from the trial balances the company already exports. A year with a missing or incomplete month is left out of the report and keeps its tab in amber, which names what is missing and what to send.
Every year in the data has a tab of its own. Four cards above the statement show revenue, gross margin, EBITDA margin and net income for the year to date, each with its monthly trend.
Prior year and the last twelve months
The prior-year column holds the same months as the year to date, so a part year is compared with the same part of the year before. The change follows as an amount and as a percentage.
A part year with twelve months of history behind it carries an LTM column between the year to date and the prior year. It is summed from the same monthly figures as the month columns, and its header names the months it covers. A full year has none, because its year to date already is twelve months. The bridge in the Transaction view reads the same LTM revenue and EBITDA.
Budget against actual
Once a budget for the year is locked, the P&L carries three more columns: the budget for the same months as the year to date, and the variance as an amount and as a percentage.
Each variance is marked favourable or adverse in words, and a variance large enough to matter is coloured as well. A button above the statement shows or hides the block.
In the group report the comparison covers EBITDA: the entities' locked budgets, converted at the same monthly rates as the actuals. Where an entity has no locked budget, the group P&L names it.
Adjusted EBITDA and the company's own layout
Where EBITDA adjustments are recorded, each one appears as a line under EBITDA with its category, followed by adjusted EBITDA and its margin, month by month.
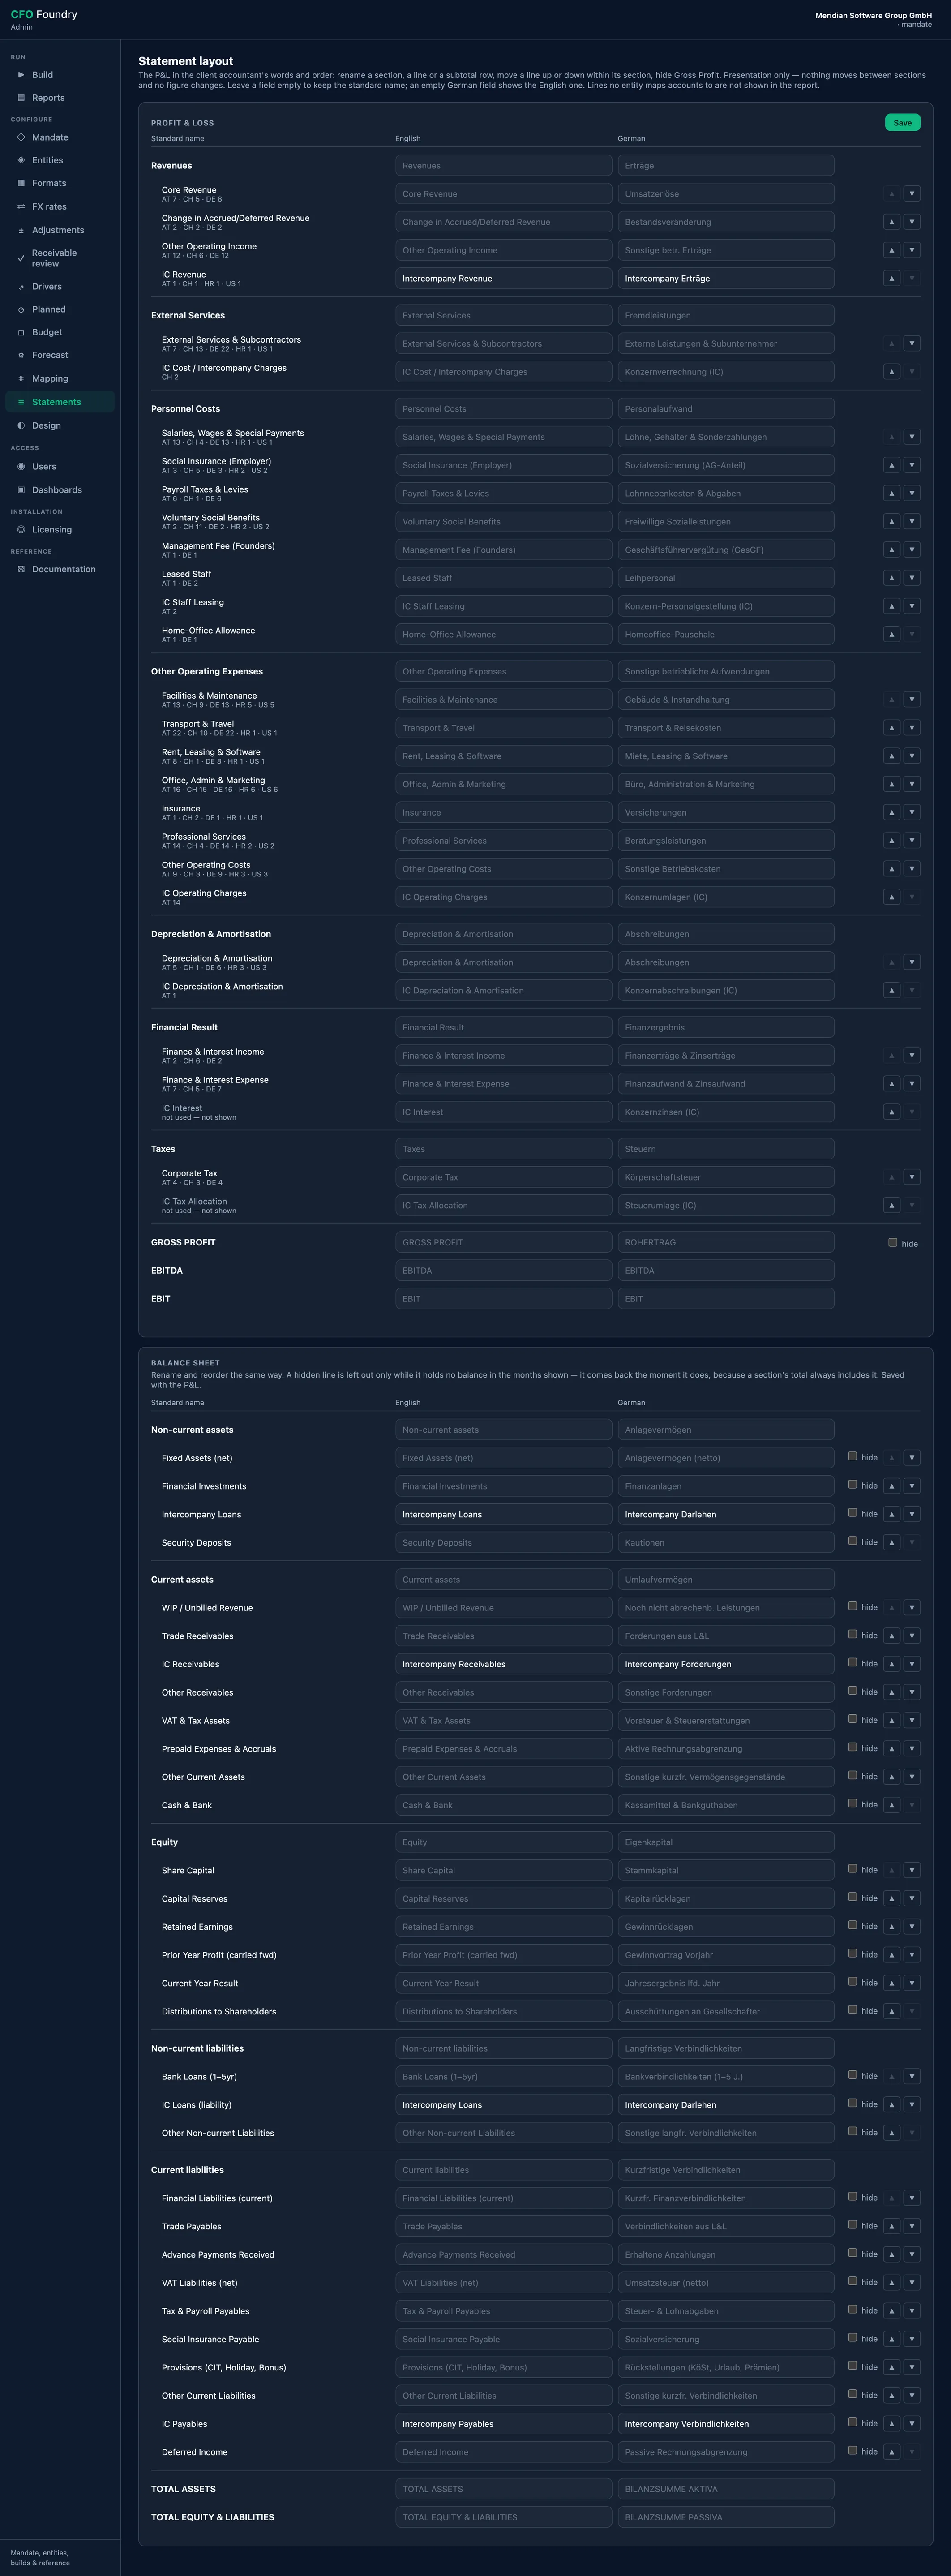
The line names and their order follow the company's own presentation. Sections and lines can be renamed in English and German, lines reordered within their section and the gross profit row hidden. Every figure stays the same, in the report and in the workbook.
In the group report, each section carries its intercompany lines with an IC badge and an elimination line beneath them.
Terms
- Gross Profit
- Revenue less external services and subcontractors.
- EBITDA
- Earnings before interest, taxes, depreciation and amortisation.
- LTM
- Last twelve months, counted back from the latest month reported.
- PY
- Prior year, over the same months as the year to date.
- Adjusted EBITDA
- EBITDA after the recorded add-backs and deductions, such as owner compensation above market or one-off costs.
Data sources
- The monthly trial balance of each entity
- The account mapping: the standard line of every profit and loss account
- The statement layout, where the company's own names and order are set
- The EBITDA adjustments, for adjusted EBITDA
- The locked budget of the year, for the budget columns
FAQ
What is LTM EBITDA?
The EBITDA of the last twelve months, counted back from the latest month reported. In a sale it is usually the earnings figure the price is set on, and the report carries it beside every part year.
How is a monthly P&L derived from a trial balance?
From the monthly trial balance and the account mapping: every account is assigned to one line once, and every month follows from the balances the accounting system exports.
Why is the gross margin of a services company so high?
Gross profit here is revenue less external services only. Internal staff are personnel costs below gross profit, so a company that delivers with its own team shows a high gross margin and carries its delivery cost in personnel.
Can the P&L follow the accountant's own presentation?
Yes, for names and order. Lines and sections take the company's own names, in English and German, and lines can be reordered within their section.
Get in touch
Describe your situation in a few lines. A reply typically follows within 1–2 business days.
To the Contact Form